1. INSIGHTS CANVAS
What IS THE LEAN AGILE INTELLIGENCE INSIGHT CANVAS DASHBOARD?
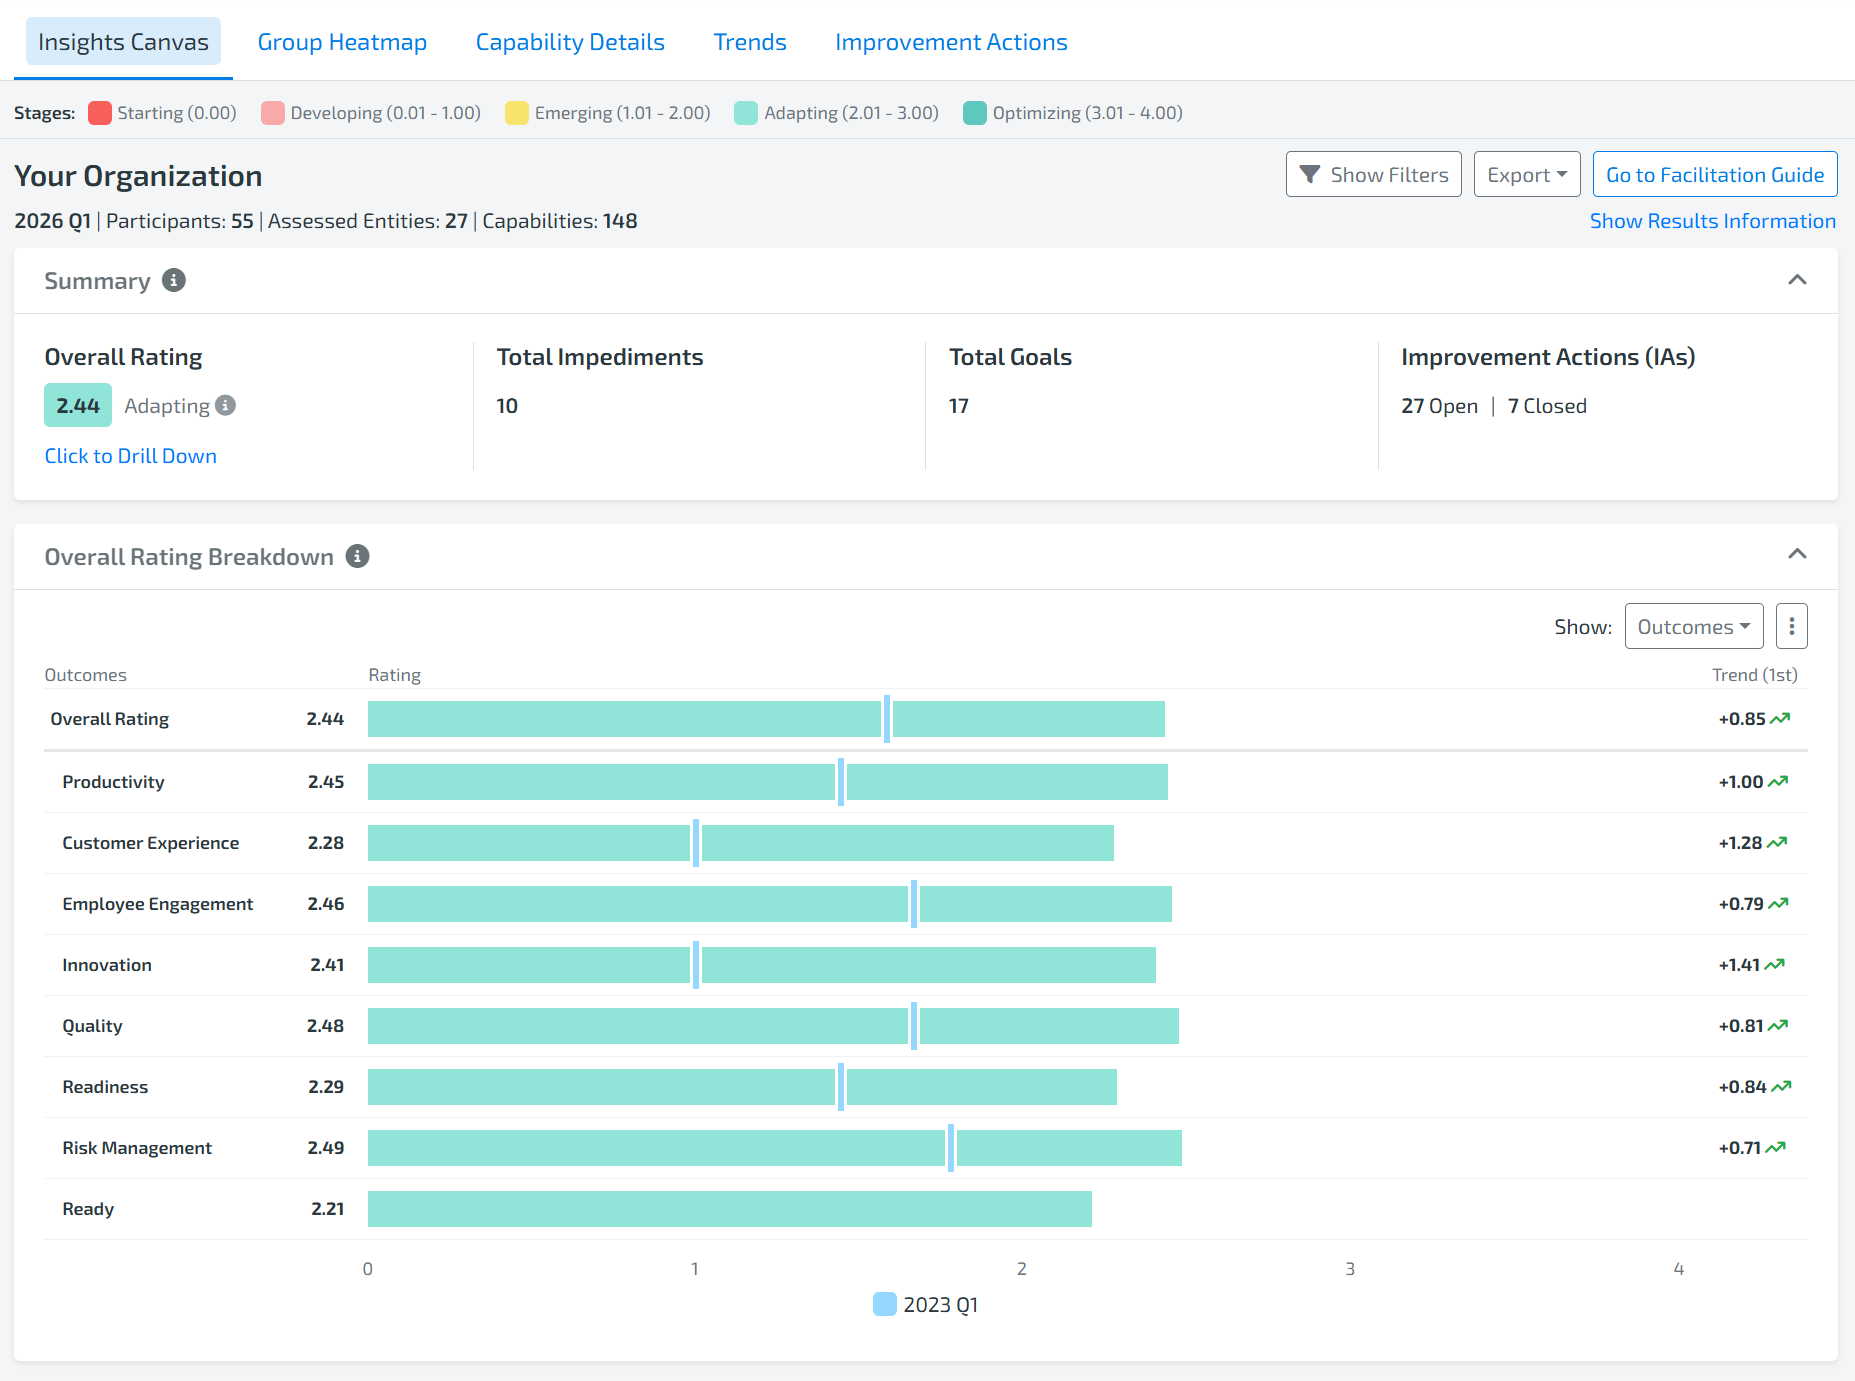
The Insights Canvas Dashboard is the default and main dashboard to gain an overall view of the Results. The widgets in this dashboard are excellent at providing a summary of the Results.
insights canvas widget summary
Results Information: An overview of the data used in calculating the Results page and various assessment statistics, including assessment completion percentages, the last assessment date, the template name, the total number of assessed Capabilities and Entities, and the total number of participants.
Summary: A high-level overview of the current assessment state, including overall Rating, Rating Trends, total Impediments, Goals, and Improvement Action counts.
Overall Rating Breakdown: A breakdown of overall Ratings by Dimension or Outcome, including trends, Goals, Impediments, and Improvement Action statistics.
Direct Descendants Heatmap: A flexible heatmap visualization that allows users to compare direct descendant Entities or Groups across Dimensions, Outcomes, and Ratings to identify patterns and trends.
Capability Ratings: A visual overview of all assessed Capabilities, grouped by Dimension, showing Ratings, Trends, Goals, and Impediments in a radial chart format.
Capability Performance: Displays the assessed Capabilities with the highest aggregate average Rating and lowest aggregate average Rating in two separate ordered list.
Capability Vote Variability: Displays the Capabilities with the highest and lowest amount of consensus there is among all received votes in two separate ordered lists
Recommended Capabilities: Uses the weighted averages from the Coaching assistant to order the Capabilities that are recommended to be focused on improving
Capability Trends Since Previous Assessment Period: Displays the Capabilities with the greatest positive and negative Rating changes compared to the previous assessment period.
Capability Trends Since First Assessment Period: Displays the Capabilities with the greatest positive and negative Rating changes compared to the first assessment period completed.
Top Capabilities By Closed Improvement Actions (IAs): Displays the Capabilities with the highest number of closed Improvement Actions, separated by Goal and Impediment classifications.
Top Capabilities Marked for Improvement: Highlights the Capabilities most frequently marked as Goals or Impediments, including associated open Improvement Actions.
Metrics: Free-form data entry tool to help visualize other metrics besides the ones inside LAI. No calculations or logic on assessment data is used in this widget.
2. GROUP HEATMAP
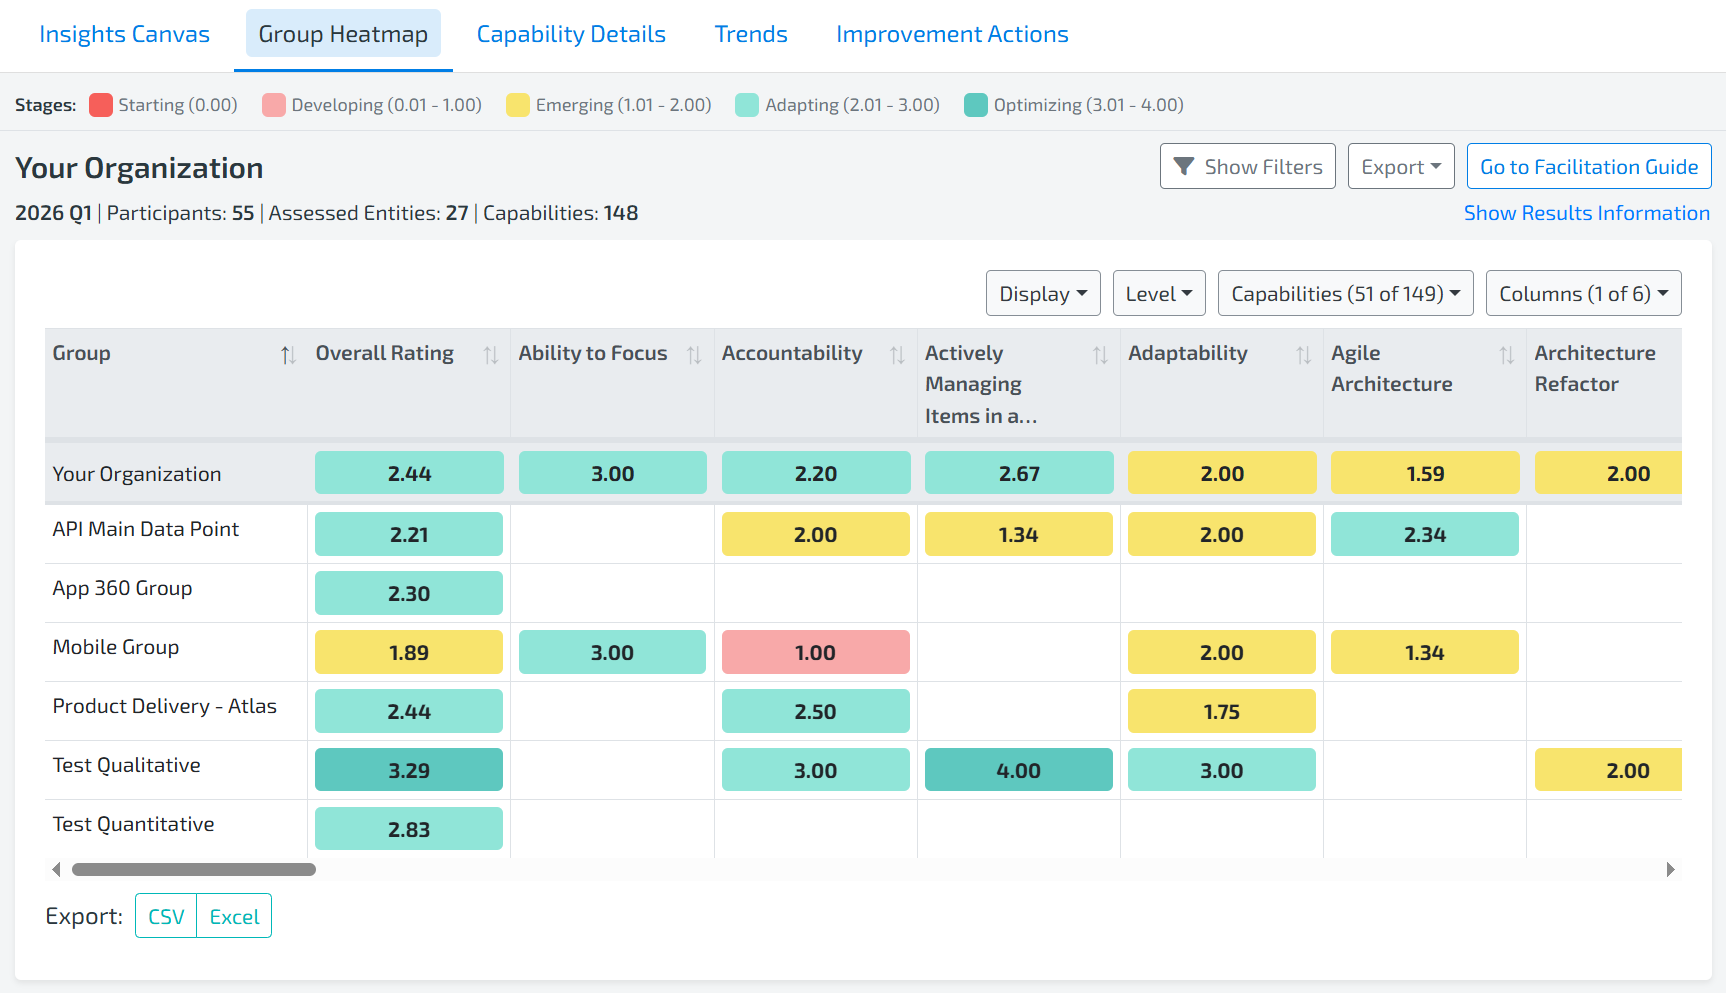
What IS THE group heatmap DASHBOARD?
The Group Heatmap Dashboard contains only one widget, but it is the most flexible widget in LAI. The design of the dashboard is to give a full-screen experience for visually viewing patterns across your Organization by utilizing visual icons, sorting, and show/hide column features.
group heatmap widget summary
Group Heatmap: Designed to view many Entities/Groups at once and visually find patterns in all types of different metrics. It is a super-flexible widget that allows aggregation via Capability, Dimension, or Outcome.
3. CAPABILITY DETAILS
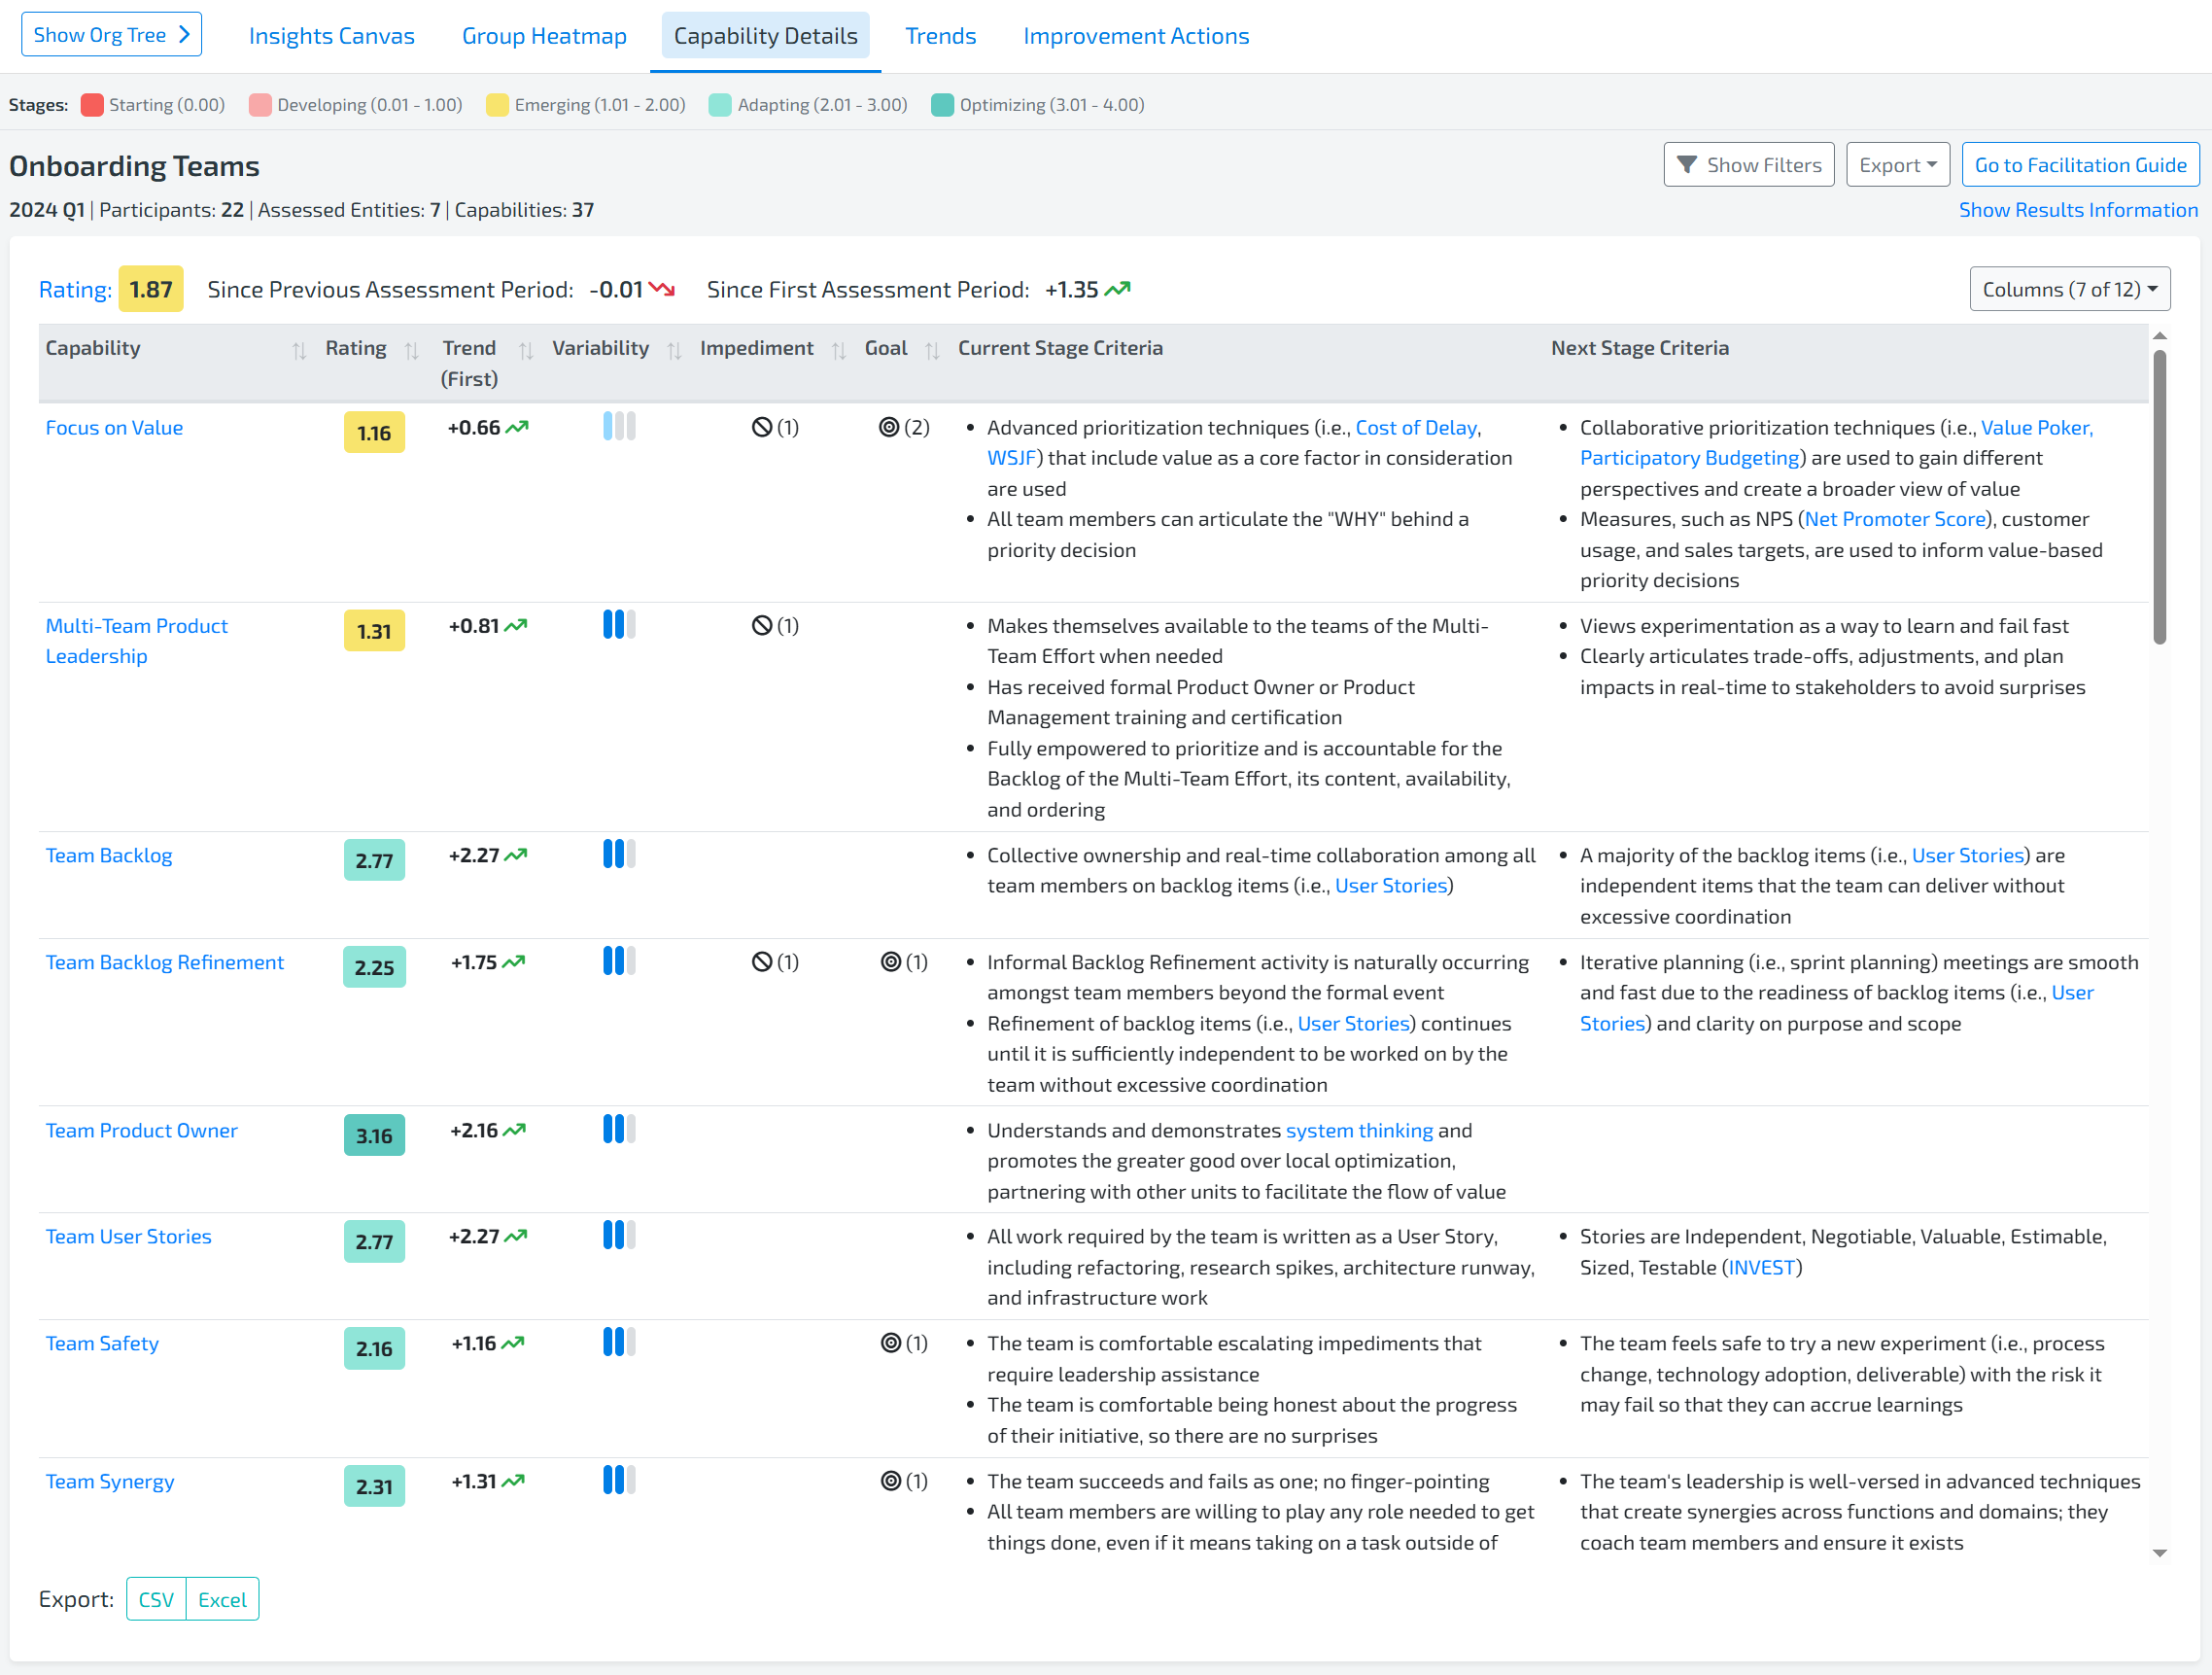
What IS THE LEAN AGILE INTELLIGENCE Capability DETAILS DASHBOARD?
The Capability Details is a tabular view of results for an Entity or Group. Use the “Show/Hide Data” section to customize the displayed columns.
Capability DETAIL COLUMNS
Capability : Name of the Capability that was assessed by the Entity or Group
Rating: Displays the current Rating of the Capability
Impediment: Displays if a capability is marked as an Impediment or not
Note: When selected on a Group, hovering over the impediment icon will show the Entities that marked the capability as an Impediment
Trend (Previous): Displays the Trend of the Rating since the last assessment taken
Note: Hover over the Trend to see the previous Rating
Trend (First): Displays the Trend of the Rating since the first assessment taken
Note: Hover over the Trend to see the first Rating
Note: This column is hidden if viewing results for a Group and the Organization setting “Show First Assessment Trend” is unchecked in the Account screen
Variability: Displays the Variability of votes
Note: Hover over Variability to see the level of variability in the votes
Current Stage Criteria: Displays the criteria for the current Stage criteria
Next Stage Criteria: Displays the criteria for the future Stage criteria
Last Assessment Comments: The assessment comments from the last completed assessment for each Capability. Only displayed by default when viewing Results for an Entity.
Last Assessment Prompts: The assessment prompt responses from the last completed assessment for each Capability. Only displayed by default when viewing Results for an Entity.
AI Comment Summary: An AI summary of the Last Assessment Comments and/or Last Assessment Prompts columns. Click “Generate AI Summary” button to enable. After clicking, the summary will remain until comments are added or removed. At least 2 comments are required to generate a summary.
Improvement Actions: The improvement actions for each Capability for each Entity. Only displayed by default when viewing Results for an Entity.
4. TRENDS
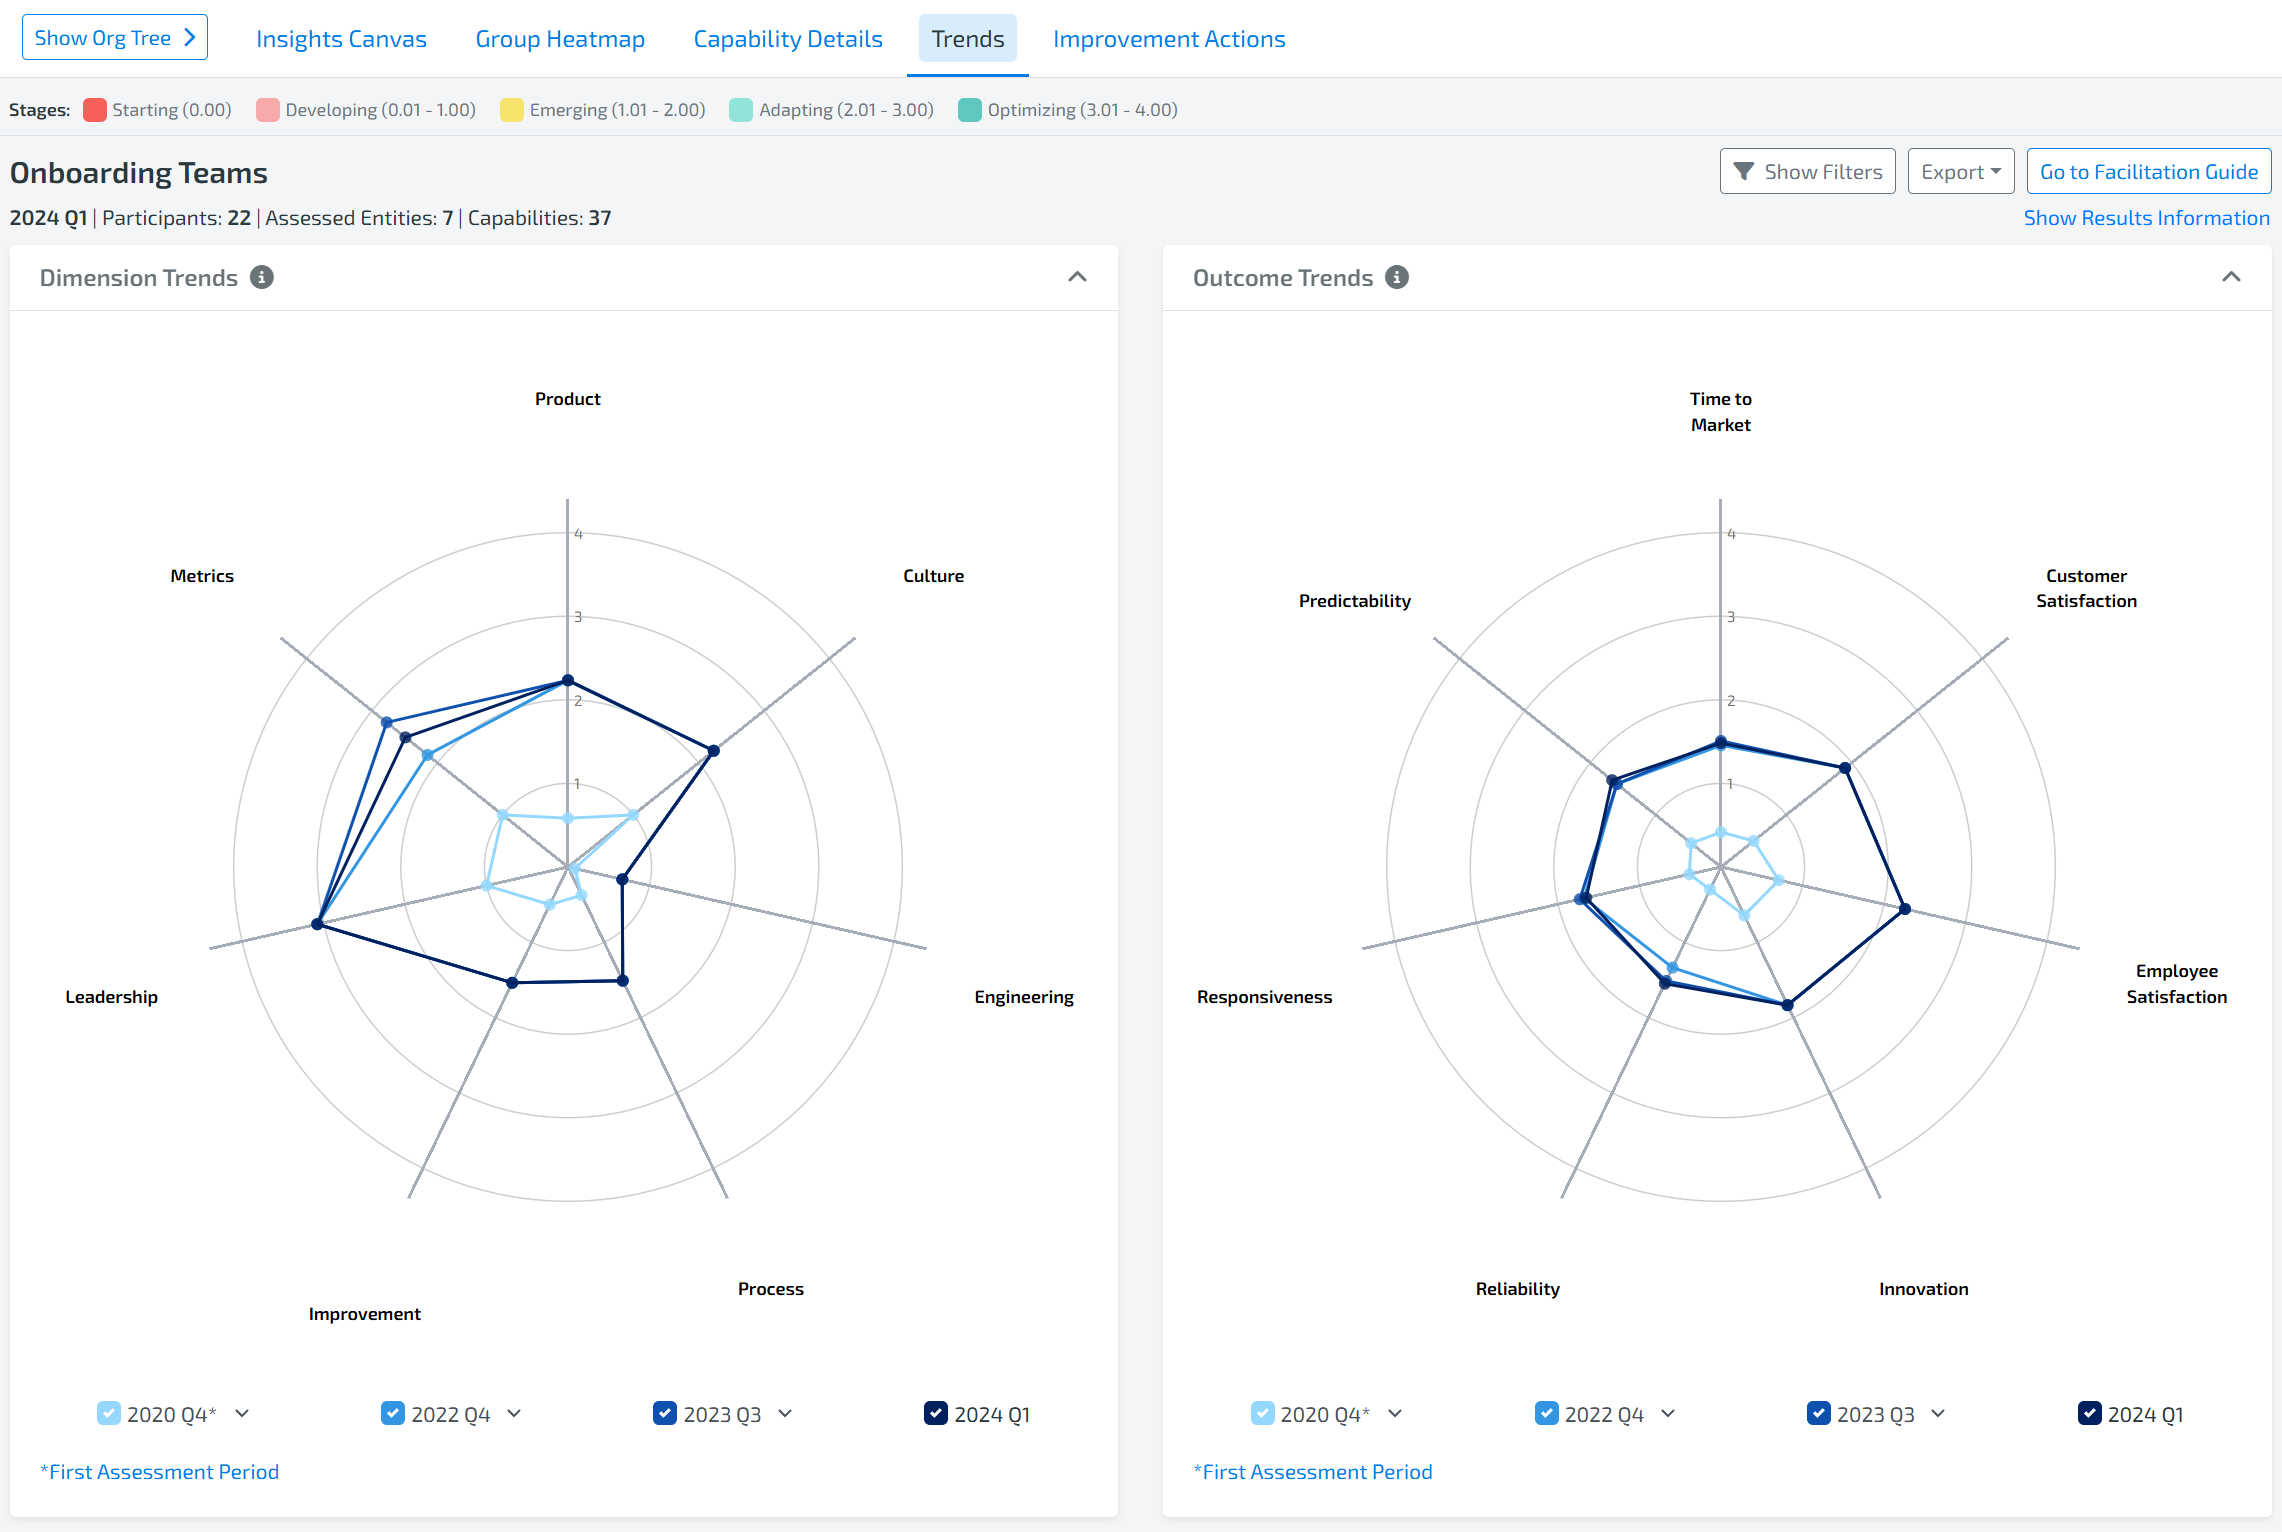
What IS THE trends DASHBOARD?
The Trends Dashboard provides Trend data on our secondary aggregations - Outcome and Dimension. Both of these are graphically displayed side-by-side, allowing you to view the improvement over time.
Trends widget summary
Dimension Trends: Plots the Dimension Ratings by Trend
Outcome Trends: Plots the Outcome Ratings by Trend
5. IMPROVEMENT ACTION DASHBOARD
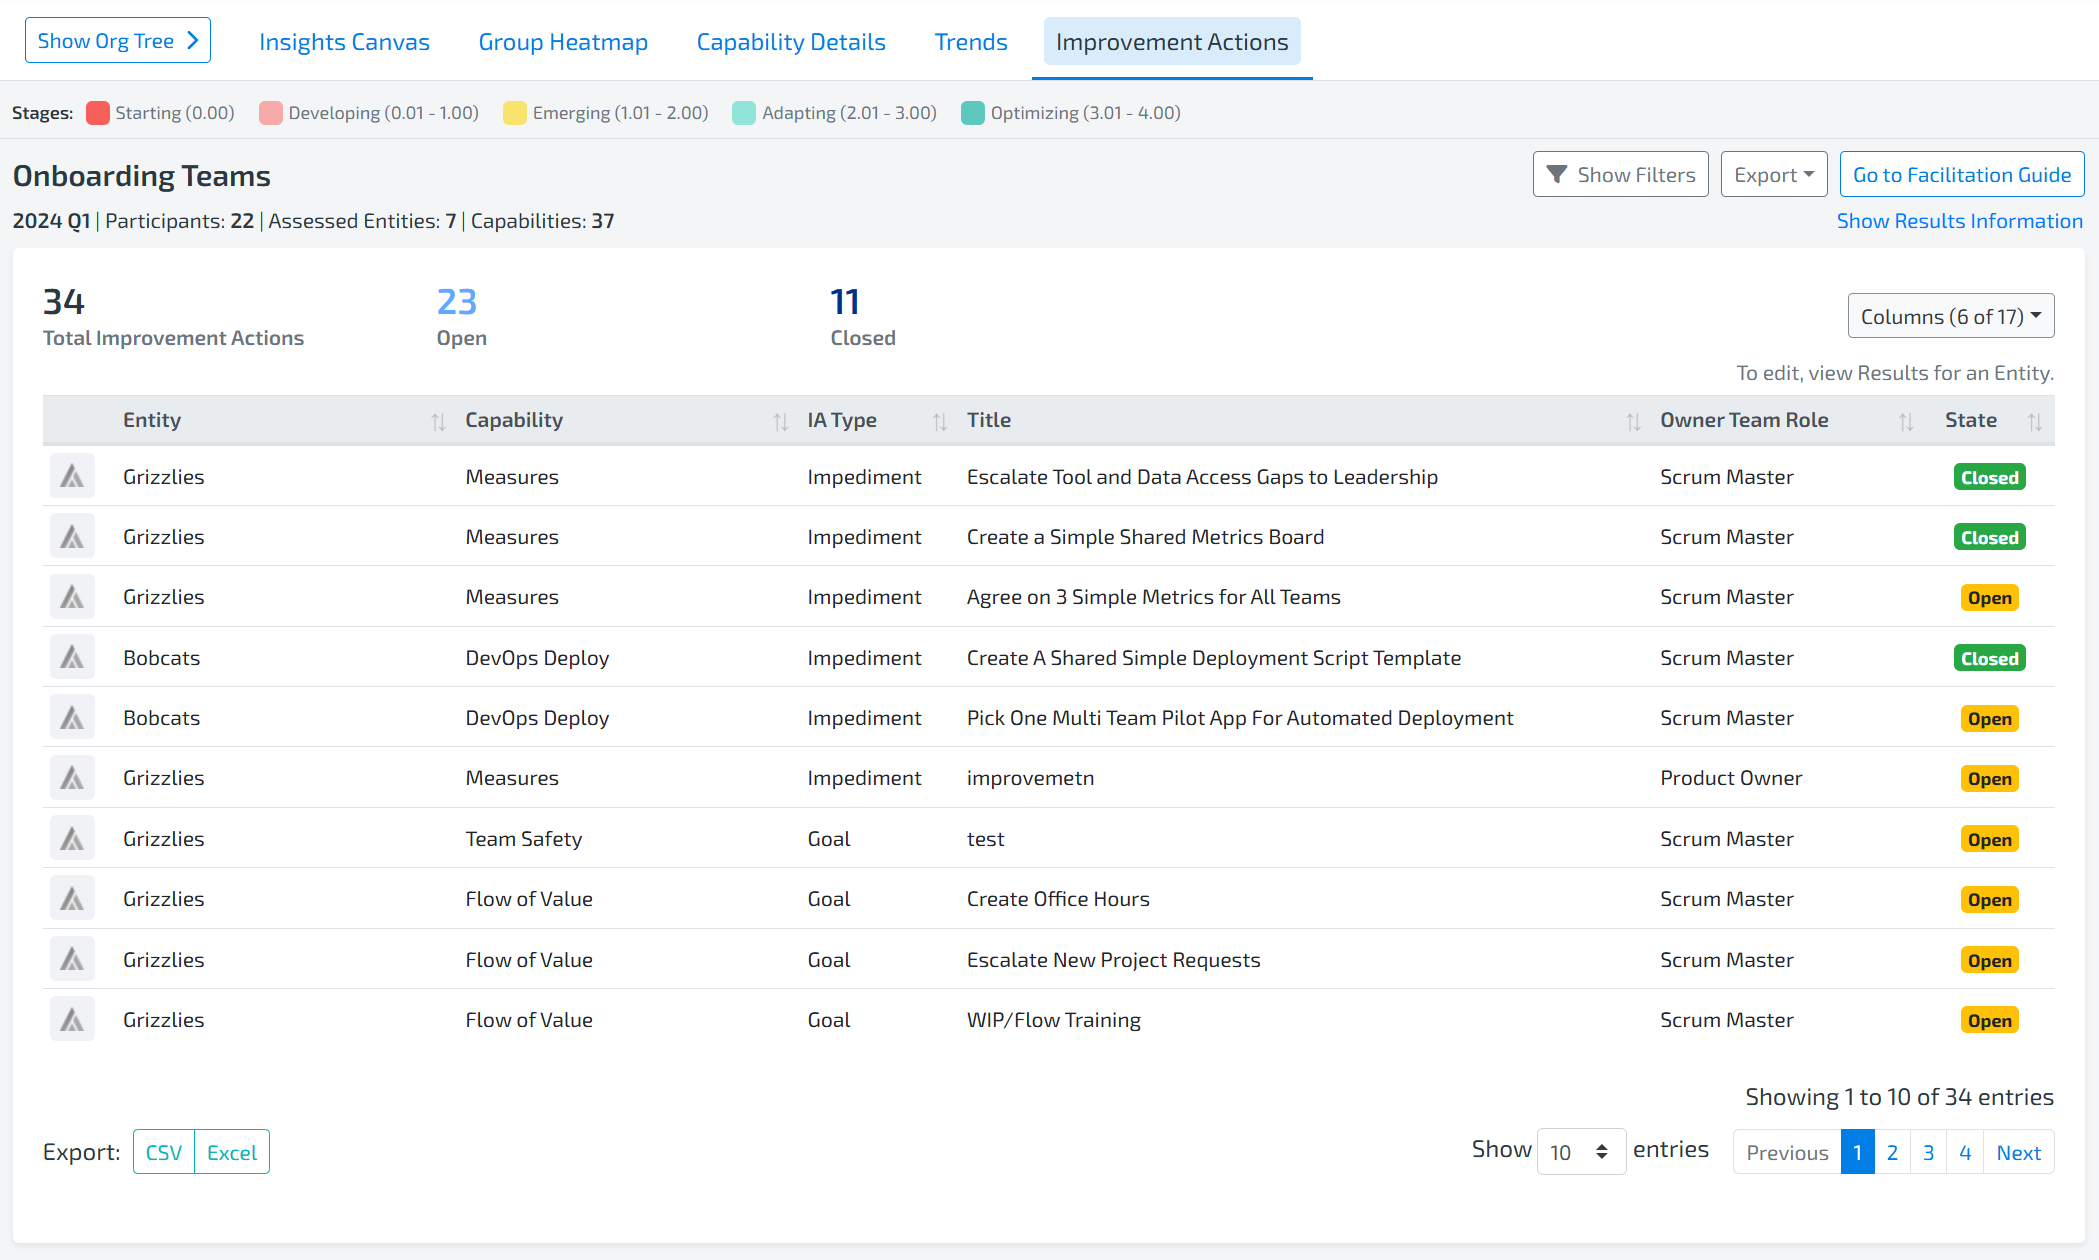
What IS THE LEAN AGILE INTELLIGENCE Improvement Actions DASHBOARD?
The Improvement Actions dashboard is an overview of all the Improvement Actions for an Entity or Group.
Note: This dashboard is unavailable for Analysts because they do not have permission to view Improvement Actions
improvement actions components
Improvement Action Summary: Various statistics on the number of Improvement Actions including Total, Open, and Closed
Improvement Action Details: Tabular view of all Improvement Actions, including ability to trigger Edit and Delete directly from the dashboard
6. CAPABILITY DRILLDOWN
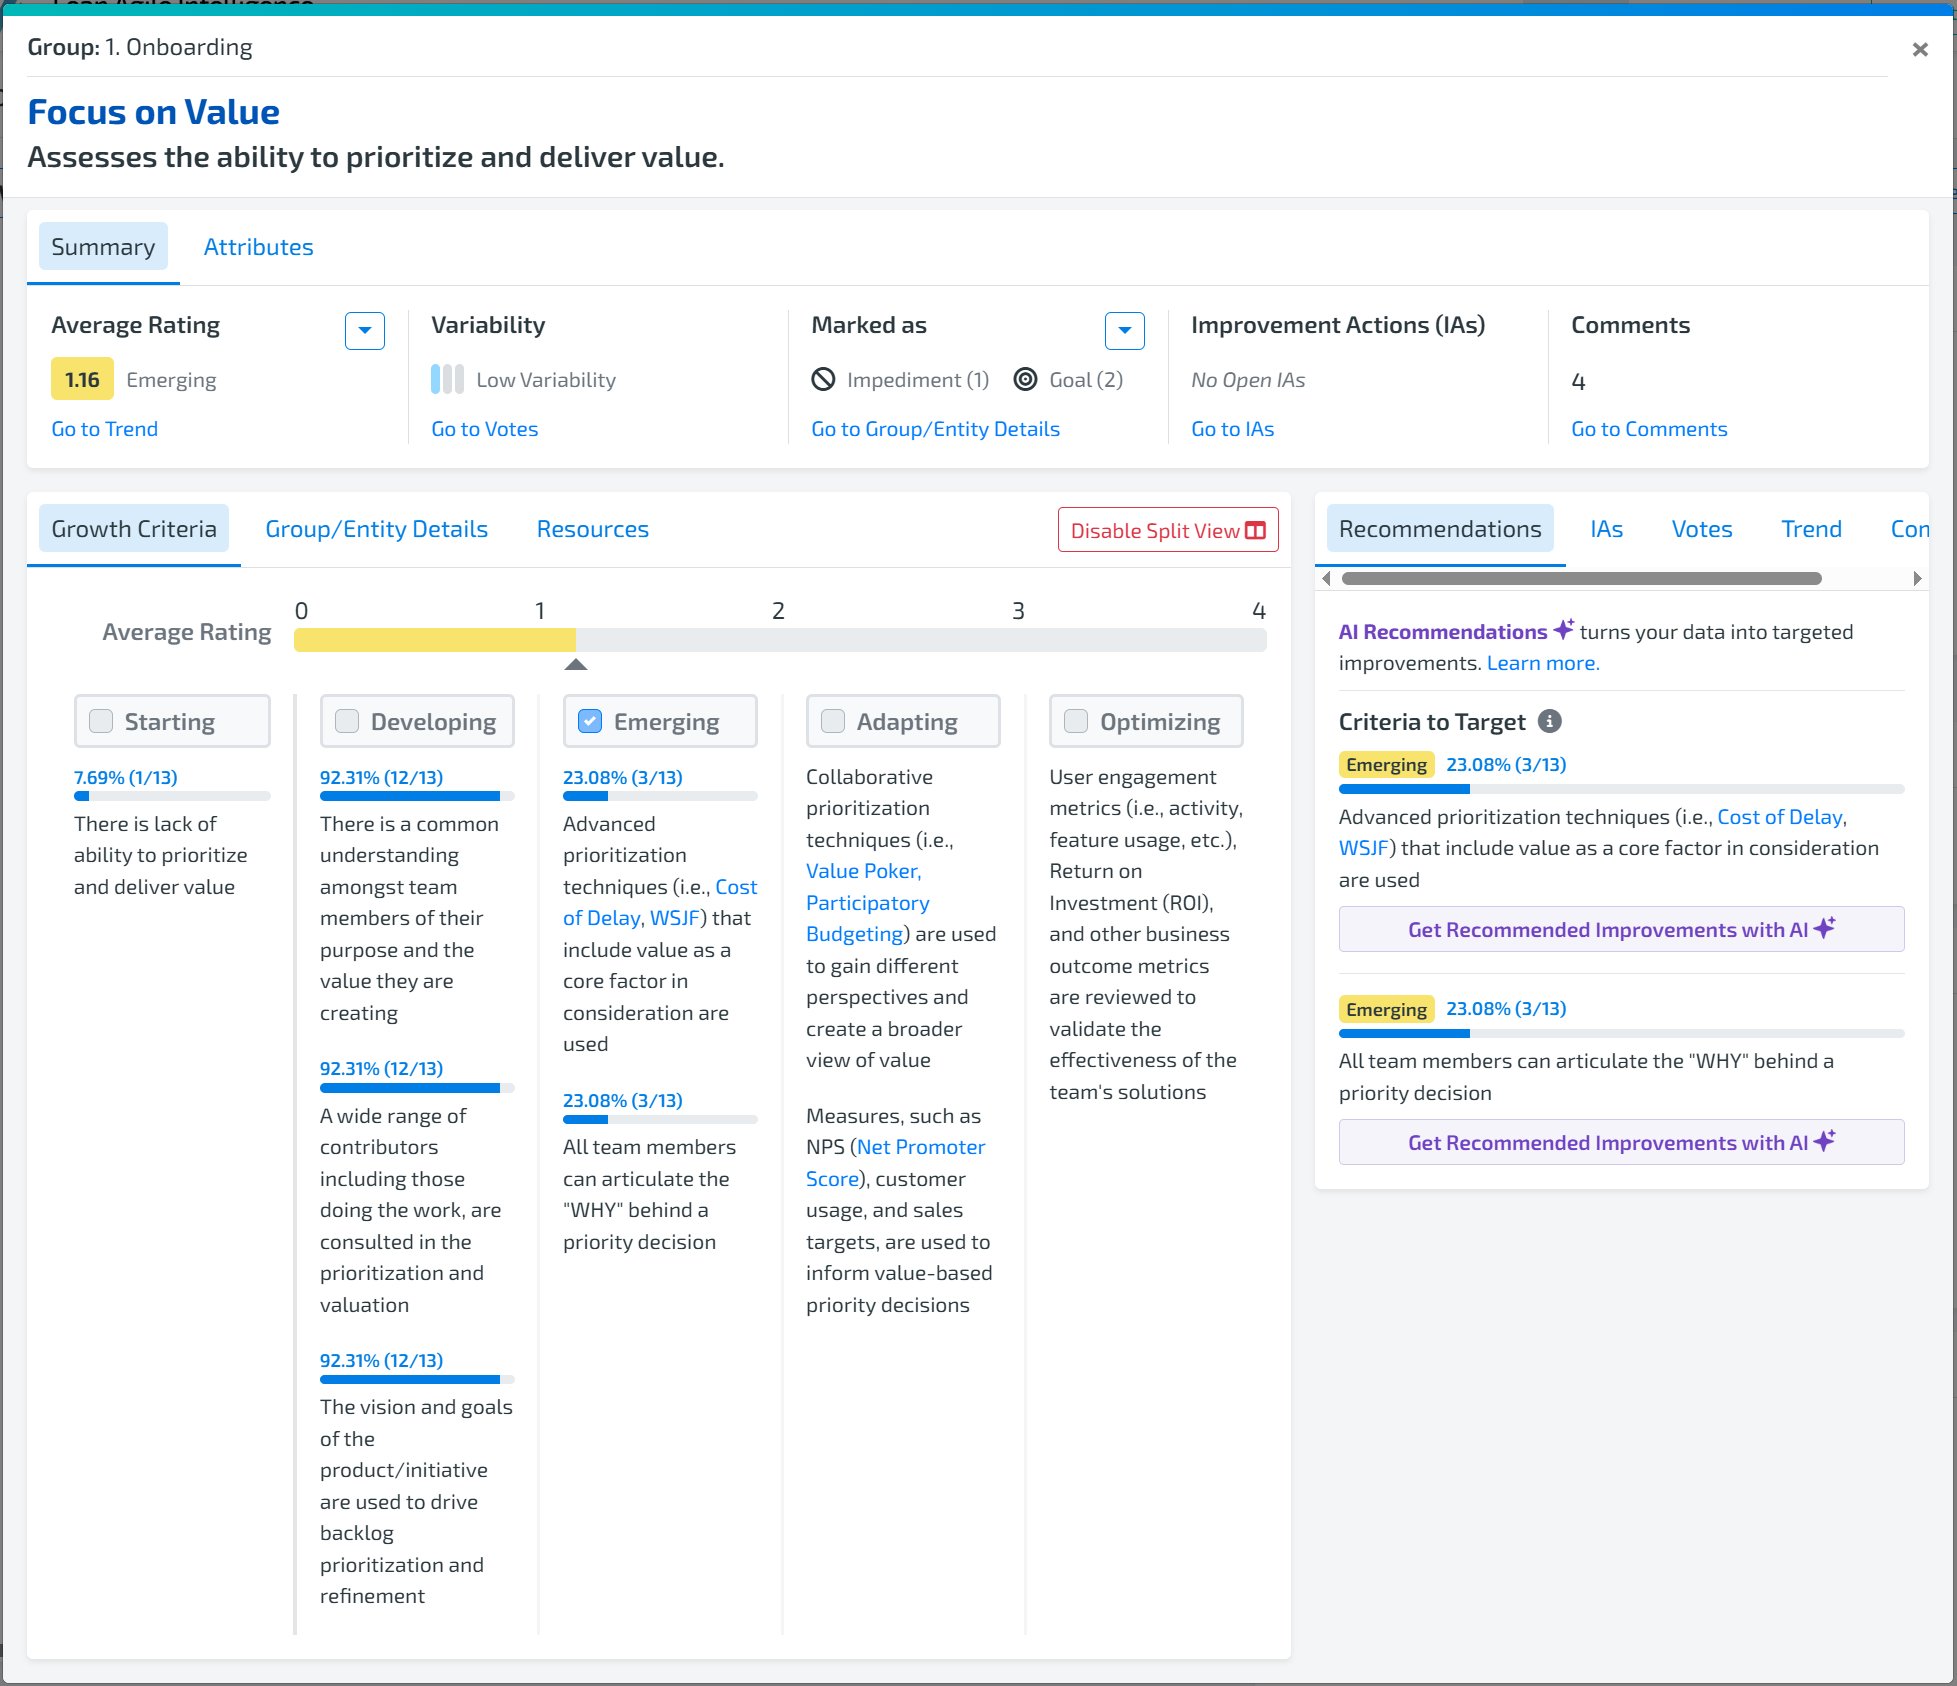
What IS THE Capability drilldown?
The Capability Drilldown is a pop-up screen that is shown whenever a Capability is selected from any of the available widgets. It shows a breakdown of details specific to that Capability
Capability drilldown summary
Capability Details: At the top of the widget are the static member-defined details about the Capability. This includes Capability Name, Capability Description, Dimension, Level, and targeted Outcomes.
Summary – A quick overview of the capability’s rating, variability, and status.
Average Rating – The current average rating based on assessment results.
Variability – The variation in scores, indicating alignment or disagreement across participants.
Marked As – Shows whether the capability is marked as a Goal or Impediment.
Improvement Actions (IAs) – Any improvement actions linked to the capability.
Comments – Participant comments related to the capability.
Attributes
Category
Out-of-the-Box: Non-editable capabilities provided by default. To customize, make a copy.
Custom: Editable, user-created capabilities.
Dimension – The “new way of working” focus area the capability supports.
Levels – The organizational levels where the capability is assessed.
Associated Outcomes – Strategic transformation objectives linked to the capability.
Growth Criteria: The Capability’s criteria as seen when taking an assessment.
The selected Stage (Starting, Developing, etc) is the Rating for the Entity/Group you are viewing.
Criteria disagreement: each criteria has the percent of participants that selected the criteria when casting their vote (abstain votes excluded)
On each criteria: the percentage of participants that selected the vote is displayed. For example, if 3 out of 5 participants select the criteria, then “60% (3/5) selected” is displayed.
Note: if there is only one vote, then only “Selected” or “Not Selected” is displayed
On each Stage, either “Full Agreement” or “Partial Agreement” is displayed.
Full Agreement: All participants agree - all criteria is either 100% selected or 0% selected
Partial Agreement: There is some disagreement - at least one criteria is 1% - 99% selected
Note: if there is only one vote, then this is hidden
Click to show your vote: The Stage of your vote for the last time this Capability was assessed for the selected Entity/Group/Organization.
This is hidden by default so if a Facilitator reviews Results with the team with screen sharing enabled, the Facilitator will still keep their vote anonymous
Override Average: Override or remove the override after an assessment is completed.
Must be viewing Results for an Entity (not a Group or Organization)
Updates the latest assessment in which the assessment was assessed.
Only available for Facilitators, Super Users, and Admins.
Mark as Impediment/Goal: Mark as an Impediment/Goal after an assessment is completed.
Must be viewing Results for an Entity (not a Group or Organization)
Updates the latest assessment in which the assessment was assessed.
Only available for Facilitators, Super Users, and Admins.
Group/Entity Details: Showcases a list of all entities that voted on this Capability and the associated Results.
Rating: The average of the votes by Group/Entity for the Capability
Trend (Previous): The Trend of the given Entity compared to the previous Trend
Trend (First): The Trend of the given Entity compared to the first Trend
Note: This value for the Group row is blank if the Organization setting “Show First Assessment Trend” is unchecked in the Account screen
Variability: The variability in ratings for the Capability
Impediment: Whether or not the Entity marked the Capability as an Impediment.
Growth Goal: Whether or not the Entity marked the Capability as an Impediment.
Group/Entity Rating: The Rating of the Entity (all Capabilities considered), not specific to the Capability. This is useful for reference purposes.
Stage: Below the Capability Details is the Stage containing the Growth Criteria. This is the information that assessments Participants use to self-evaluate. The Stage with a check mark is the average Stage for that Capability. If you did not vote, then a message will appear saying that you did not vote for the Capability at the bottom.
Mark as Growth Goal / Mark as Impediment: Only shown at the Entity level. Allows members to edit the Impediment/Growth Goal status without having to re-enter an assessment. When this is clicked, the last assessment for that Entity to include this Capability is retroactively marked/unmarked.
Helpful Resources: Links to outside resources that were added In the template builder.
Votes: Shows the distribution of votes among Stages and Ratings for the Capability for al checked Entities.
Check/Uncheck Groups/Entities in the Group/Entity Details pane to include/exclude Groups/Entities from the vote distribution
Select from the ‘Votes by’ drop down to see the results in Stage, Rating, Role or other Member Attribute available.
If more than one Member Attribute is available, you will also have the option to further segment the votes by selecting another Member Attribute to ‘Group by.’ For more information on Member Attributes, check out this documentation.
Note: Ratings and Stages will show almost the same data unless “Enable Partial Credit” Organization Setting is enabled
Comments: Shows all recorded Comments (both System, Member, and Prompts) for this Capability.
Check/Uncheck Groups/Entities in the Group/Entity Details pane to include/exclude Groups/Entities from the comments
Show System Comments: Toggles the visibility of system-generated comments. The toggle will be hidden if there are no system-generated comments.
AI Summary: An AI summary of all the comments in the time period (calendar quarter in most cases). At least 2 comments are required to generate a summary. After generating a summary, the summary will remain until comments are added or removed.
Improvement Actions: Customized action items are available when viewing Results for an Entity.
Check/Uncheck Groups/Entities in the Group/Entity Details pane to include/exclude Groups/Entities from the vote distribution
Select the “+” icon to add a new improvement action
Add a type, title, description. owner role, and link if needed
Change the Status once the action has been completed.
Note: Jira integration is available for your improvement action goals!
Trends: A graph that plots the Capability ratings over time.
Note: checking/unchecking Groups/Entities in the Group/Entity Details pane will NOT change this graph in any way.
Recommendations – AI-generated or manually created improvement ideas.
Check out this documentation for more information on the Capability Drill Down.
7. ENTITY/GROUP DRILLDOWN
What IS THE Group/Entity drilldown?
The Group/Entity Drilldown is a pop-up screen that is shown whenever the Rating link is selected from any of the available widgets. It shows a breakdown by Group/Entity of all overall data.
Summary – A quick overview of the capability’s rating, variability, and status.
Rating – The current average rating based on assessment results.
Marked As – Shows whether the capability is marked as a Goal or Impediment.
Assessed Entities – Number of Entities that voted
Assessed Capabilities – Number of Capabilities assessed and used in the results
Assessed Participants – Number of Participants that voted
Attributes
Category
Out-of-the-Box: Non-editable capabilities provided by default. To customize, make a copy.
Custom: Editable, user-created capabilities.
Entity/Group selector: A dropdown that controls what is displayed in the Grid below.
Entity will list all Entities that descend from the Group you are viewing
Group will list all Groups that descend from the Group you are viewing
Note: this selector will not appear if you are viewing Result for an Entity or the selected Group has no child Groups
Show all descendant Entities: When checked, will display all Groups that descend. When unchecked, only the immediate children of the Group you are viewing are displayed.
Note: this checkbox only appears if the Entity/Group selector has “Group” selected and if there are any Groups that not immediate children.
Rating Details: At the top of the widget are the static details about the Entity/Group Rating and the total Assessed Capability and Entities.
Group/Entity Details: Showcases a list of all entities/groups that voted and the associated Results.
Group/Entity: Name of the Group or Entity for which the row’s results are applicable
Rating: The average of the votes by Entity for the Capability
Trend (Previous): The Trend of the given Entity compared to the previous Trend
Trend (First): The Trend of the given Entity compared to the first Trend
Note: This value is hidden for Groups if the Organization setting “Show First Assessment Trend” is unchecked in the Account screen
Impediment: Whether or not the Entity marked the Capability as an Impediment.
Goal: Whether or not the Entity marked the Capability as an Impediment.
Template Name: The name of the Template that was taken by the Entity/Group. If the Entity/Group contains Results for more than one Template, then “(multiple)” is displayed.
Trend: A graph that plots the Entity/Group Rating over time
Votes: Shows the distribution of votes among Stages and Ratings for the Capability for all checked Entities.
Check/Uncheck Groups/Entities in the Group/Entity Details pane to include/exclude Groups/Entities from the vote distribution
Select from the ‘Votes by’ drop down to see the results in Stage, Rating, Role or other Member Attribute available.
If more than one Member Attribute is available, you will also have the option to further segment the votes by selecting another Member Attribute to ‘Group by.’ For more information on Member Attributes, check out this documentation.
Note: Ratings and Stages will show almost the same data unless “Enable Partial Credit” Organization Setting is enabled
8. OUTCOME DRILLDOWN
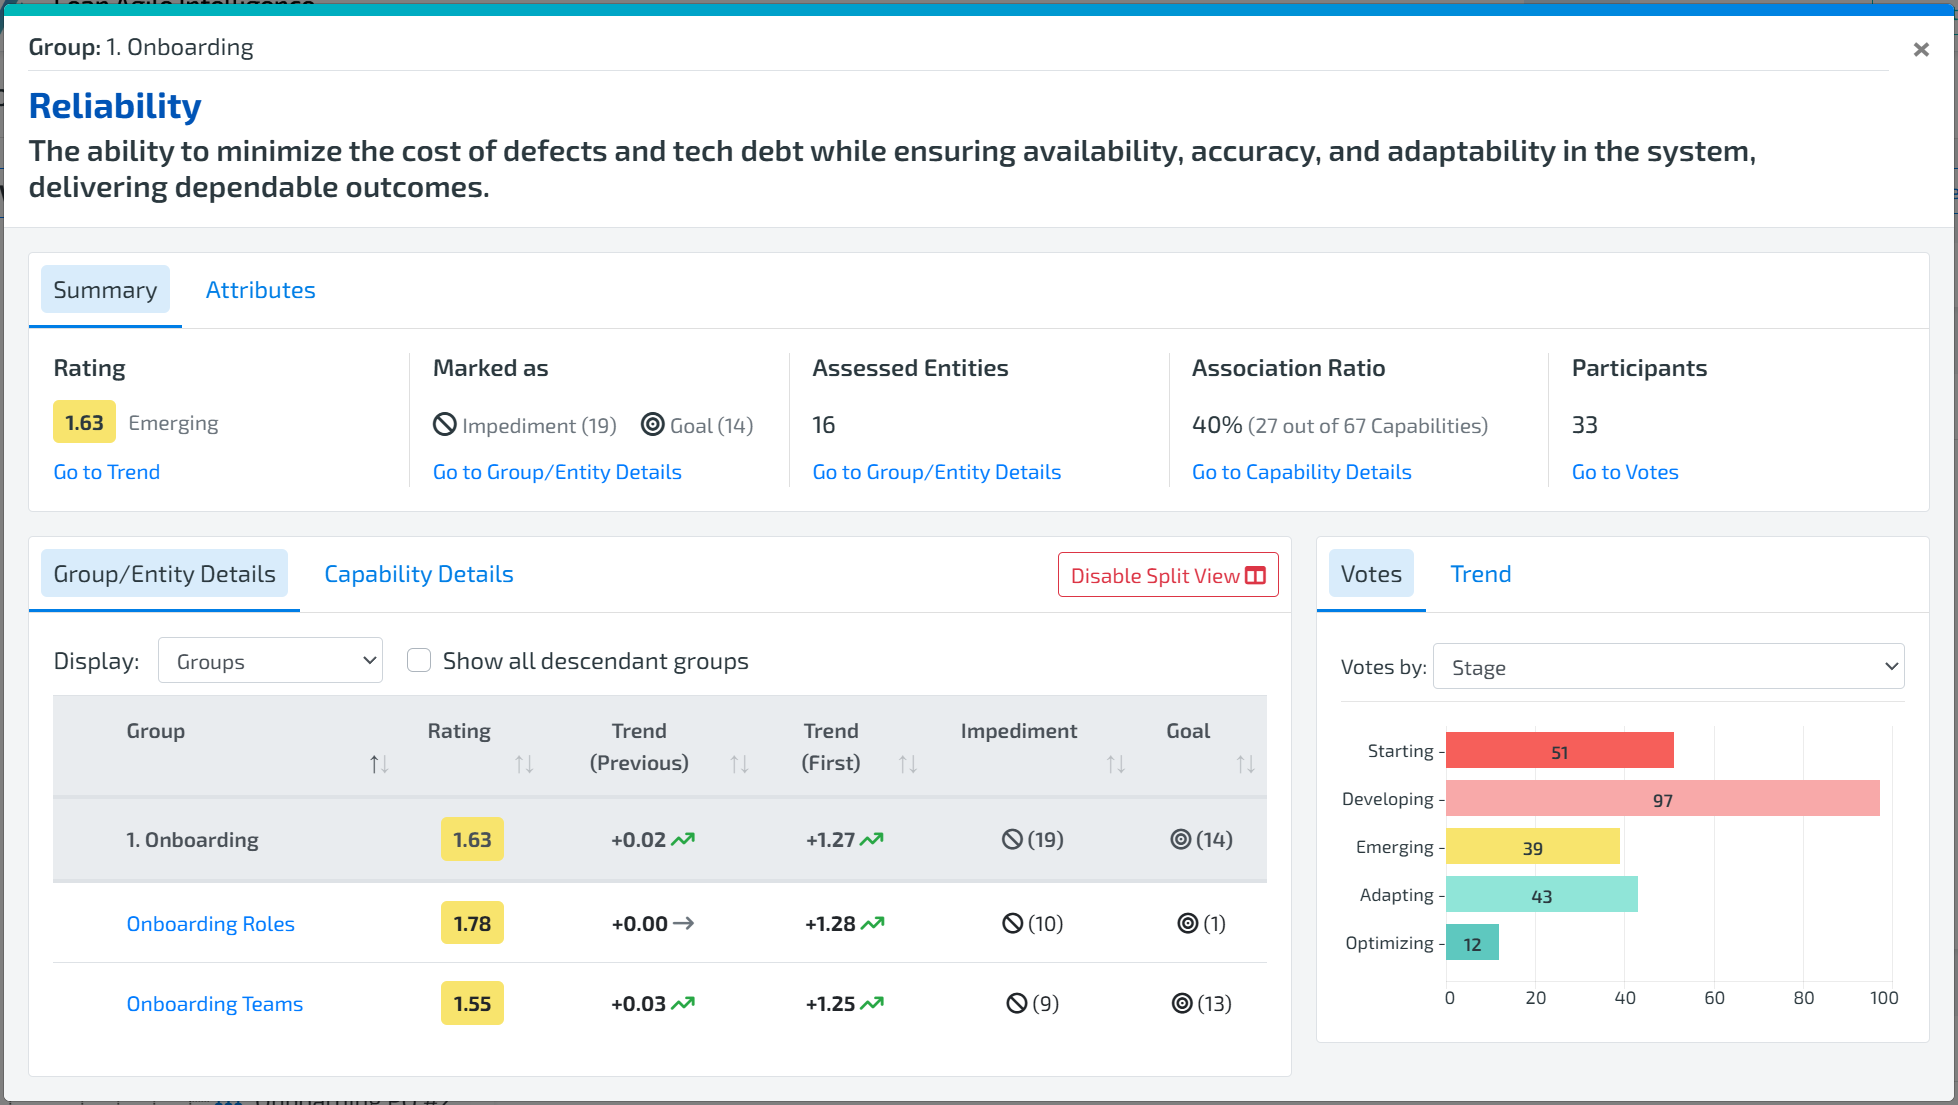
What IS THE outcome drilldown?
The Outcome Drilldown is a pop-up screen that is shown whenever the Outcome link is selected from any of the available widgets. It shows a breakdown by Entity/Group of Capabilities that associate with the chosen Outcome.
Summary – A quick overview of the capability’s rating, variability, and status.
Rating – The current average rating based on assessment results.
Marked As – Shows whether the capability is marked as a Goal or Impediment.
Assessed Entities – Number of Entities that voted
Association Ratio – Percentage of the Capabilities with the outcome out of all the Capabilities used in the calculation of the results
Participants – Number of Participants that voted
Attributes
Category
Out-of-the-Box: Non-editable capabilities provided by default. To customize, make a copy.
Custom: Editable, user-created capabilities.
Entity/Group selector: A dropdown that controls what is displayed in the Grid below.
Entity will list all Entities that descend from the Group you are viewing
Group will list all Groups that descend from the Group you are viewing
Note: this selector will not appear if you are viewing Result for an Entity or the selected Group has no child Groups
Show all descendant Entities: When checked, will display all Groups that descend. When unchecked, only the immediate children of the Group you are viewing are displayed.
Note: this checkbox only appears if the Group/Entity selector has “Group” selected and if there are any Groups that are not immediate children.
Outcome Details: At the top of the widget are the static details about the Outcome and the Association Ratio - a percentage of how many Capabilities are associated with the Outcome.
Group/Entity Details: Showcases a list of all entities/groups that voted and the associated Results.
Entity/Group: Name of the Group or Entity for which the row’s results are applicable
Rating: The average of the votes by Entity for all the Capabilities that associate with the Outcome
Trend (Previous): The Trend of the given Entity compared to the previous Trend
Trend (First): The Trend of the given Entity compared to the first Trend
Note: This value is hidden for Groups if the Organization setting “Show First Assessment Trend” is unchecked in the Account screen
Impediment: Whether or not the Entity marked any Capability that associates with the Outcome as an Impediment.
Goal: Whether or not the Entity marked any Capability that associates with the Outcome as an Impediment.
Template Name: The name of the Template that was taken by the Entity/Group. If the Entity/Group contains Results for more than one Template, then “(multiple)” is displayed.
Trend: A graph that plots the Outcome ratings over time. A blue comparison trend is shown that compares the Entity/Group Rating against the Outcome Rating.
Votes: Shows the distribution of votes among Stages and Ratings for the Capability for all checked Entities.
Check/Uncheck Groups/Entities in the Group/Entity Details pane to include/exclude Groups/Entities from the vote distribution
Select from the ‘Votes by’ drop down to see the results in Stage, Rating, Role or other Member Attribute available.
If more than one Member Attribute is available, you will also have the option to further segment the votes by selecting another Member Attribute to ‘Group by.’ For more information on Member Attributes, check out this documentation.
Note: Ratings and Stages will show almost the same data unless “Enable Partial Credit” Organization Setting is enabled
9. DIMENSION DRILLDOWN
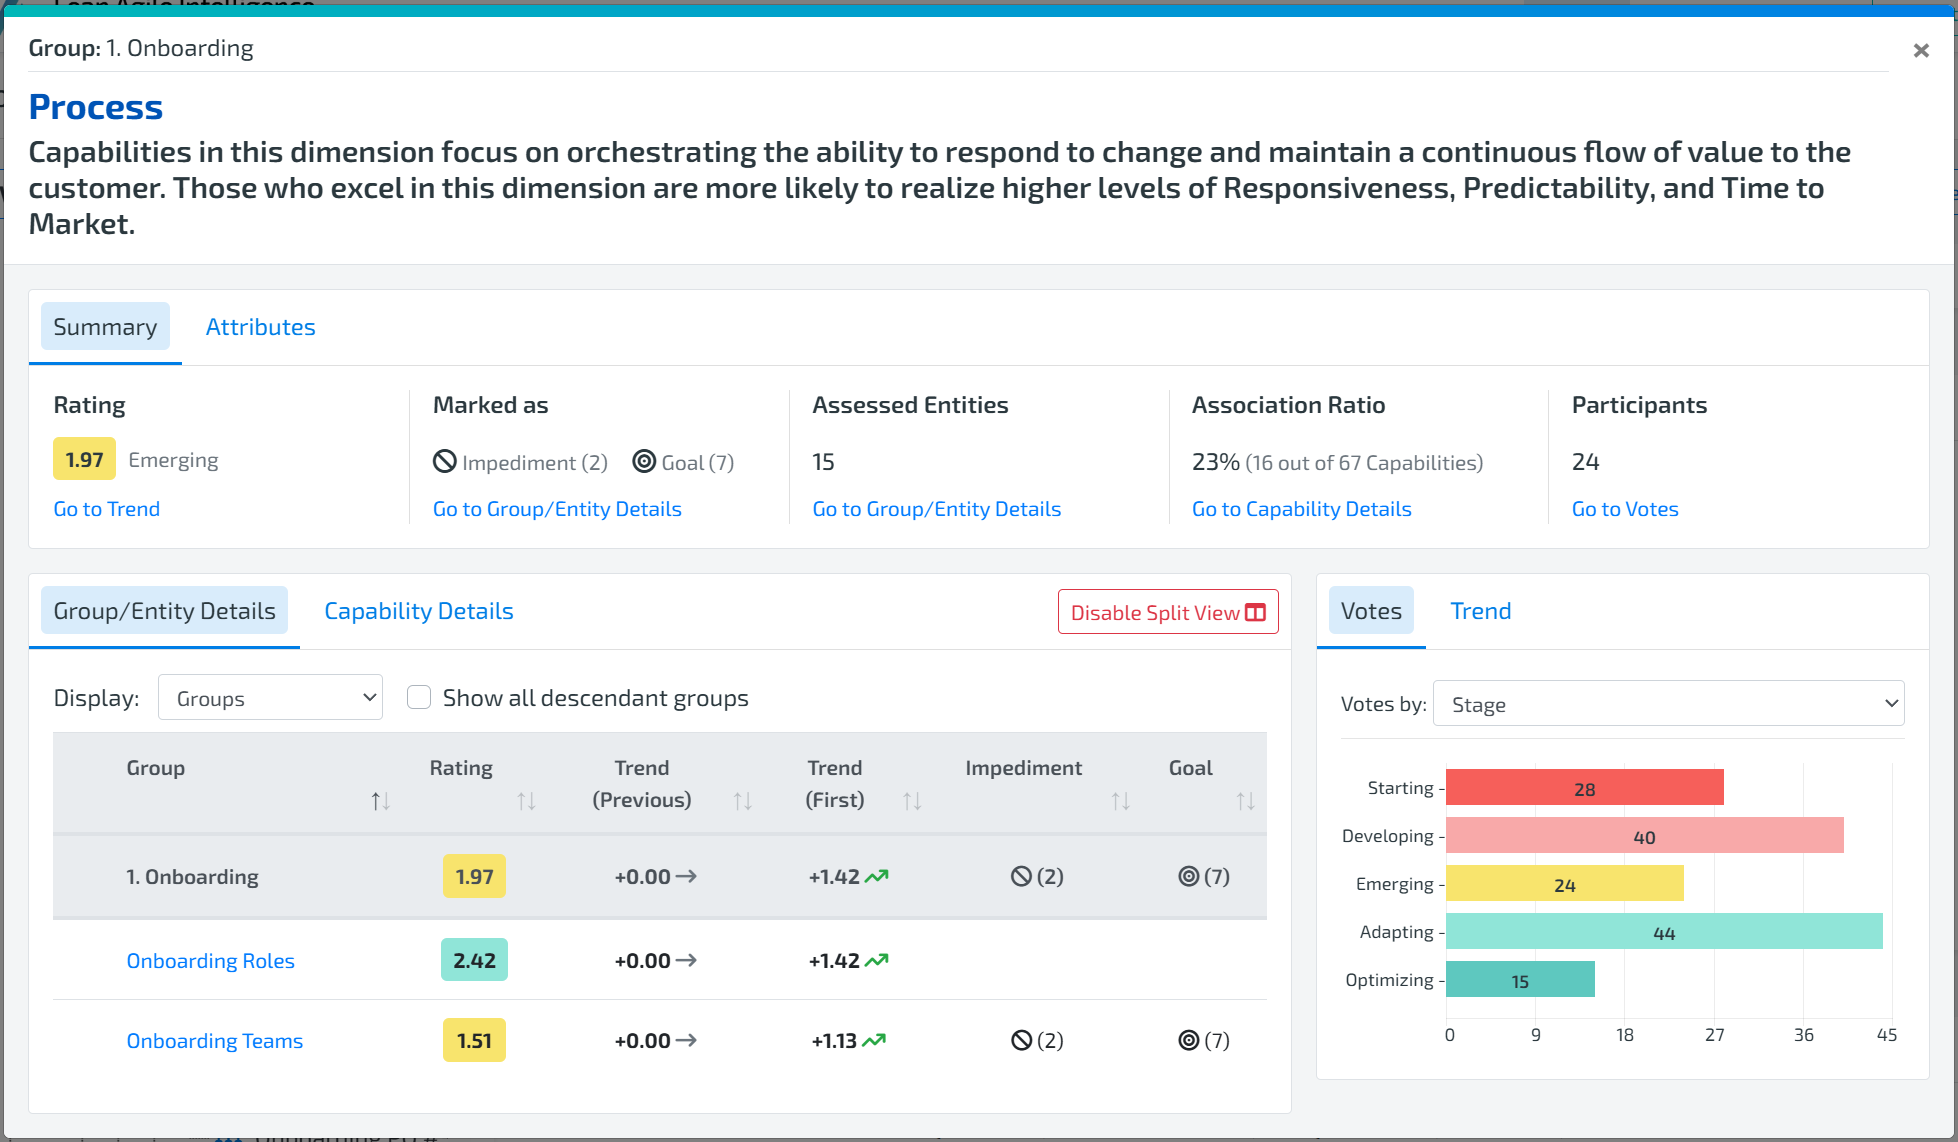
What IS THE Dimension drilldown?
The Dimension Drilldown is a pop-up screen that is shown whenever the Dimension link is selected from any of the available widgets. It shows a breakdown by Entity/Group of Capabilities that are in the chosen Dimension.
Summary – A quick overview of the capability’s rating, variability, and status.
Rating – The current average rating based on assessment results.
Marked As – Shows whether the capability is marked as a Goal or Impediment.
Assessed Entities – Number of Entities that voted
Association Ratio – Percentage of the Capabilities with the dimension out of all the Capabilities used in the calculation of the results
Participants – Number of Participants that voted
Attributes
Category
Out-of-the-Box: Non-editable capabilities provided by default. To customize, make a copy.
Custom: Editable, user-created capabilities.
Entity/Group selector: A dropdown that controls what is displayed in the Grid below.
Entity will list all Entities that descend from the Group you are viewing
Group will list all Groups that descend from the Group you are viewing
Note: this selector will not appear if you are viewing Result for an Entity or the selected Group has no child Groups
Show all descendant Entities: When checked, will display all Groups that descend. When unchecked, only the immediate children of the Group you are viewing are displayed.
Note: this checkbox only appears if the Entity/Group selector has “Group” selected and if there are any Groups that not immediate children.
Dimension Details: At the top of the widget are the static details about the Dimension and the Association Ratio - a percentage of how many Capabilities are in the Dimension.
Group/Entity Details: Showcases a list of all entities/groups that voted and the associated Results.
Group/Entity: Name of the Group or Entity for which the row’s results are applicable
Rating: The average of the votes by Entity for all the Capabilities that are in the Dimension
Trend (Previous): The Trend of the given Entity compared to the previous Trend
Trend (First): The Trend of the given Entity compared to the first Trend
Note: This value is hidden for Groups if the Organization setting “Show First Assessment Trend” is unchecked in the Account screen
Impediment: Whether or not the Entity marked any Capability that is in the Dimension as an Impediment.
Goal: Whether or not the Entity marked any Capability that is in the Dimension as an Impediment.
Template Name: The name of the Template that was taken by the Entity/Group. If the Entity/Group contains Results for more than one Template, then “(multiple)” is displayed.
Trend: A graph that plots the Dimension Rating over time. A blue comparison trend is shown that compares the Entity/Group Rating against the Dimension Rating.
Votes: Shows the distribution of votes among Stages and Ratings for the Capability for all checked Entities.
Check/Uncheck Groups/Entities in the Group/Entity Details pane to include/exclude Groups/Entities from the vote distribution
Select from the ‘Votes by’ drop down to see the results in Stage, Rating, Role or other Member Attribute available.
If more than one Member Attribute is available, you will also have the option to further segment the votes by selecting another Member Attribute to ‘Group by.’ For more information on Member Attributes, check out this documentation.
Note: Ratings and Stages will show almost the same data unless “Enable Partial Credit” Organization Setting is enabled
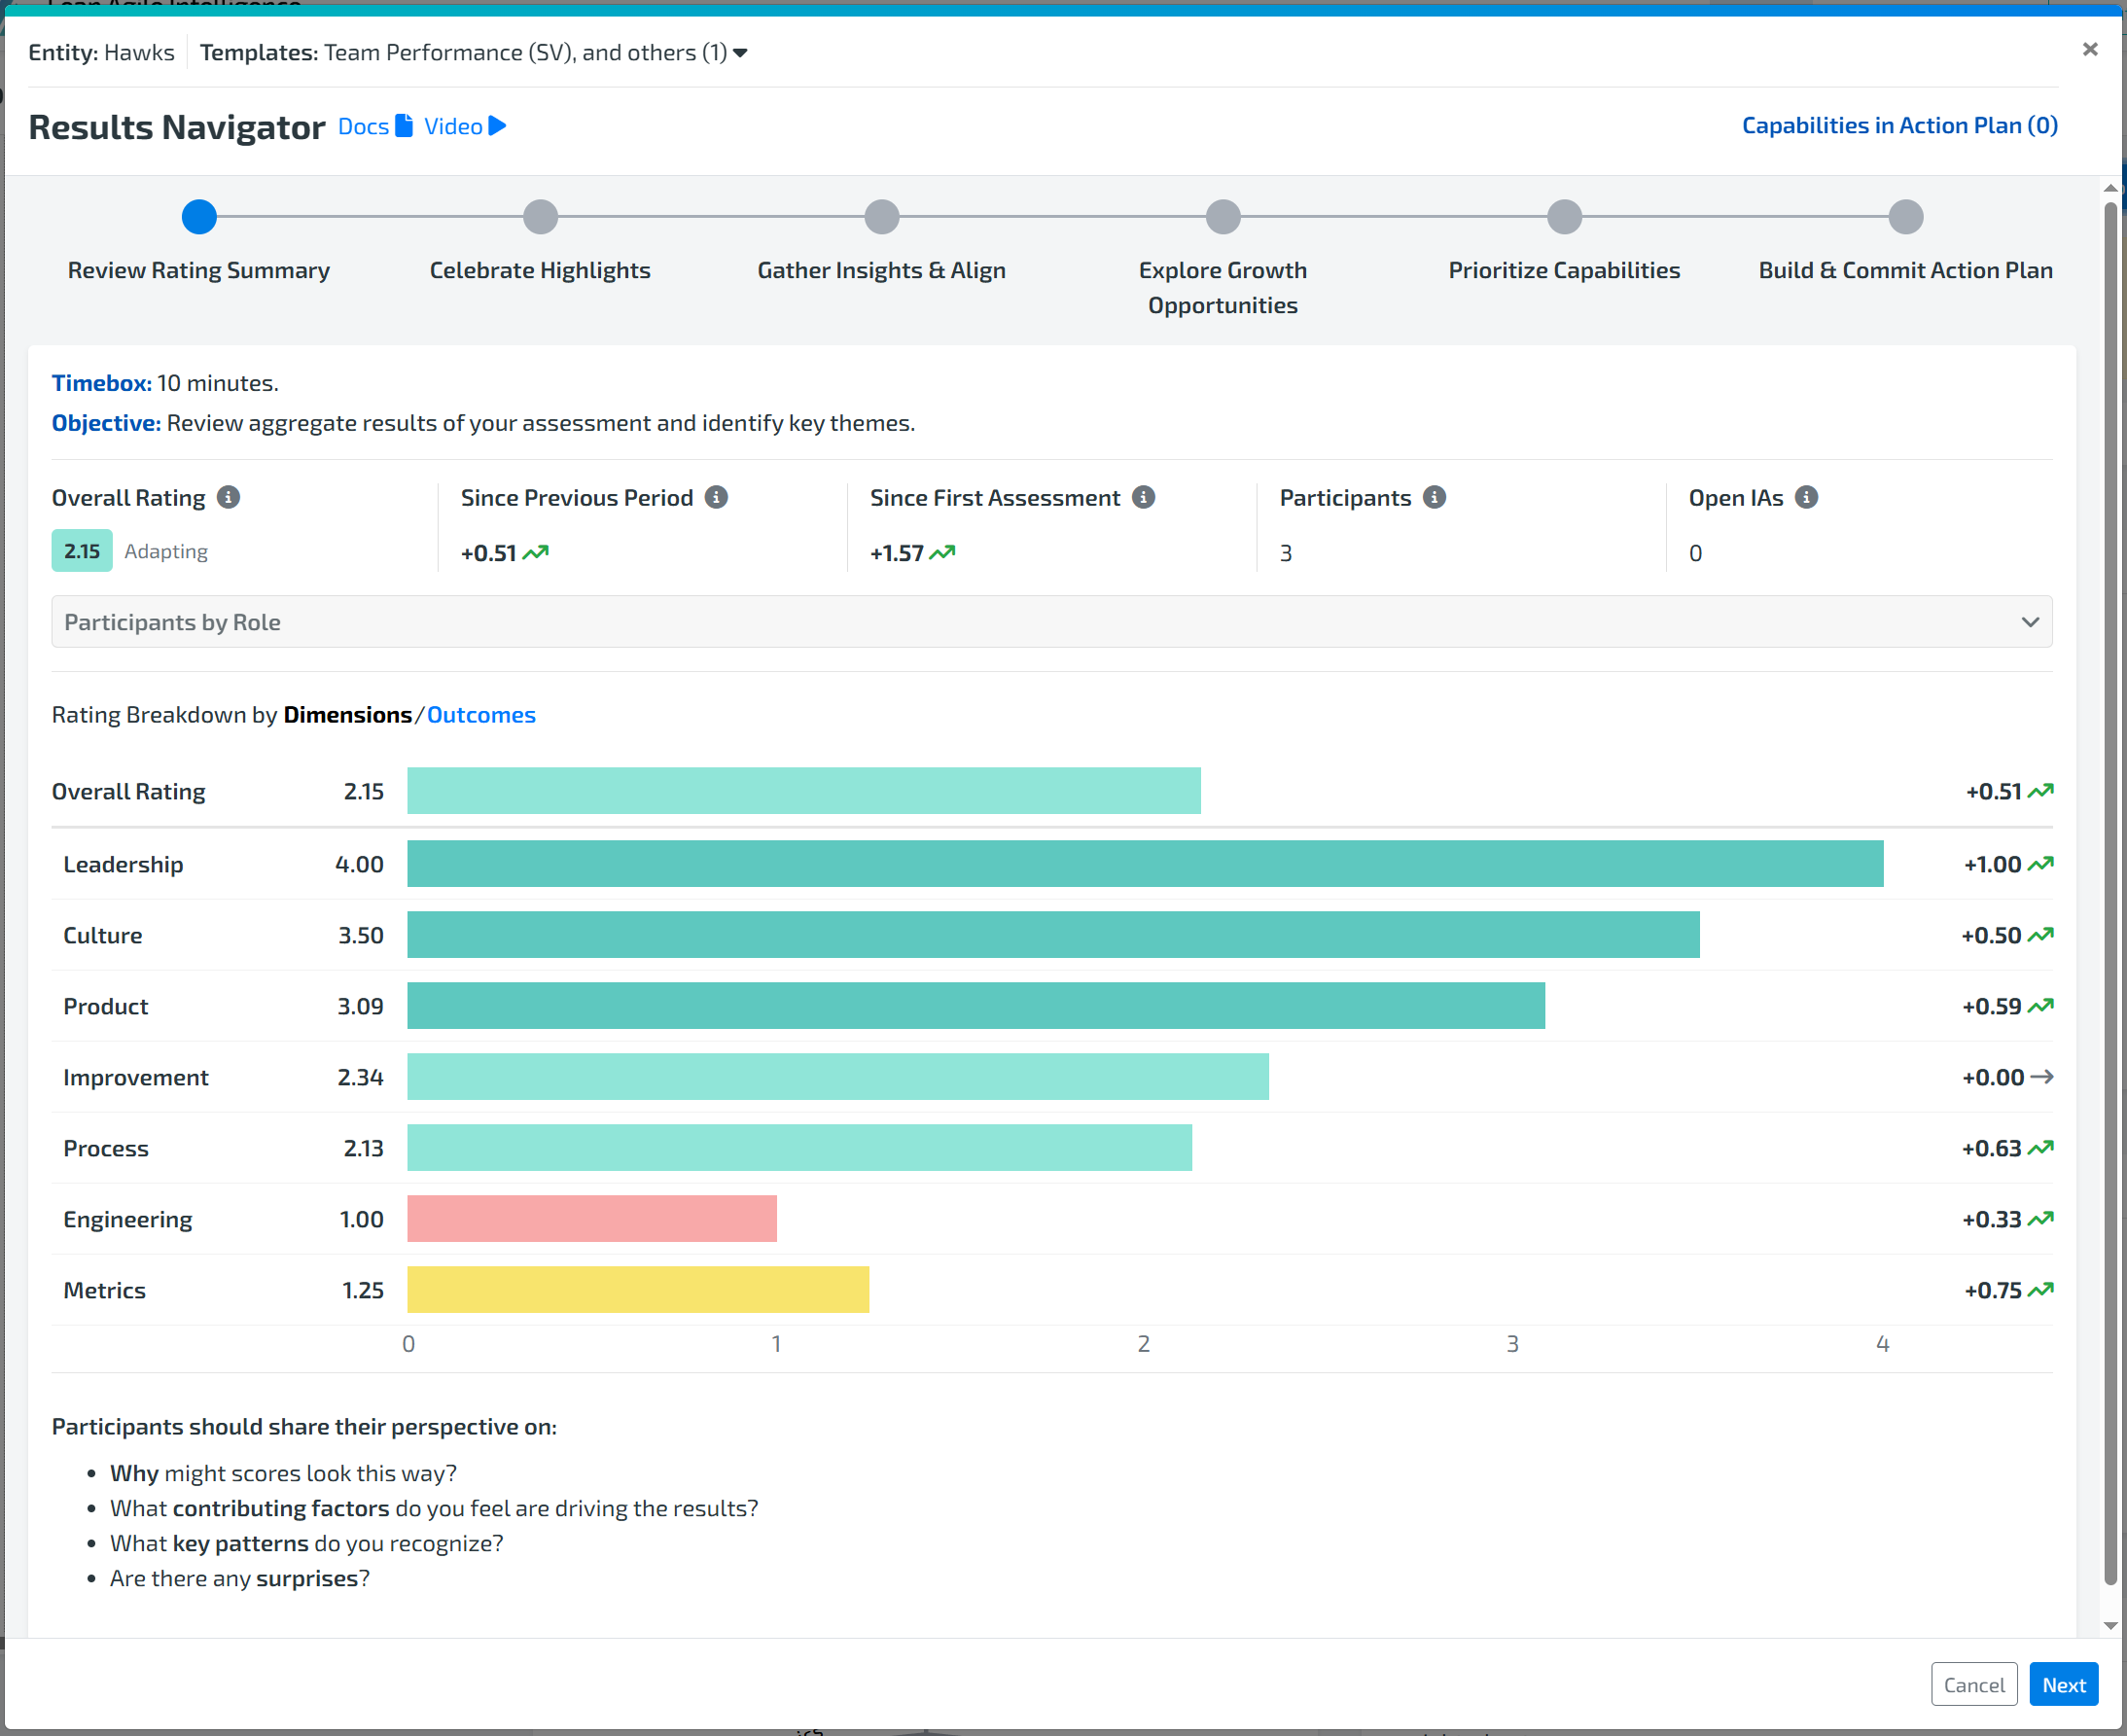
What IS THE Results navigator?
The Results Navigator is a pop-up step-by-step guide for improvement for Facilitators. While it is mainly used for improvement, it does review Results and displays assessment data, just like other dashboards and drilldowns.
Across all steps except Review Previous Action Plan step
Capabilities are listed in Results and carry the following information - note that different information may appear based on which step and section the Capability is displayed
Checkbox - add or remove the capability from the current action plan
Note that capabilities already marked as an impediment/goal cannot be removed the current action plan until they are first unmarked as an impediment/goal
Capability Name
IAs count - number of open improvement actions
Impediment/Goal - whether the Capability is currently marked as an impediment or goal.
Percent increase since previous period
Number of comments - the number of non-system comments in the latest assessment for this Capability
Rating
Variability
Improvement Actions listed below - a list of all open IAs
Note that all capabilities are clickable to open Capability Drilldown
Information in the Capability Drilldown will default differently based on which step of the Capability Drilldown you are on. For example, when drilling down from Most Comments, it will default to showing the Comments tab for easy access to the relevant information.
Review Previous Action Plan step
Capabilities in previous action plan - those marked as impediment or goal in the previous period
Capability Name
IAs count - number of open and closed IAs (note that closed IAs only includes those closed or modified since the previous period (last assessment)).
Impediment/Goal - whether the Capability was previous marked as an impediment or goal. This is not a current impediment/goal indicator for the Review Previous Action Plan step
Percent increase since previous period
Rating
Improvement Actions listed below - just like IAs count, this has the same qualifications for IAs to be included.
Review Rating Summary step
Overall Rating - The aggregate average rating across all capabilities in the selected templates.
Since Previous Period - Percent increase of Overall Rating since previous period.(last calendar quarter, unless custom time periods are set up)
Since First Assessment - Percent increase of Overall Rating since the first period (first assessment)
Participants - Total number of participants in the selected templates.
Open IAs - Total open Improvement Actions for the capabilities in the selected templates.
Participants by Role - a breakdown of the participants by their chosen role
Note: this will not appear if Role is not being supplied to participants
Rating Breakdown by Dimensions/Outcomes - the current aggregate average rating by Dimension/Outcomes and their associated percent increase for the selected templates.
Celebrate Highlights step
Highest Performing - same as Performance widget Highest Performing.
A maximum of 3 capabilities are shown.
Highest Improving - includes any capability with an improvement (positive percent increase in Rating) from the previous period.
Ordered from highest improving to lowest. If tied, variability (lowest to highest) is used. If tied, Rating (highest to lowest) is used. If tied, alphabetical by Capability name is used.
A maximum of 3 capabilities are shown.
Gather Insights & Align step
High Voting Variability - same as Vote Variability widget Highest Variability
Ordered from highest to lowest variability. If tied, Rating (lowest to highest) is used. If tied, alphabetical by Capability name is used.
A maximum of 3 capabilities are shown.
Most Comments - shows all capabilities with 2 or more comments (not including automatic, system-generated comments) in the past assessment.
Ordered from most comments to least. If tied, Variability (highest to lowest) is used. If tied, Rating (lowest to highest) is used. If tied, alphabetical by Capability name is used.
A maximum of 3 capabilities are shown.
Explore Growth Opportunities step
Lowest Performing - same as Performance widget Lowest Performing.
A maximum of 3 capabilities are shown.
Recommended Capabilities - same as Recommendations widget Practices & Behaviors
A maximum of 3 capabilities are shown.