
1. BASICS
What is THE BASIC CALCULATION in LEAN AGILE INTELLIGENCE DAHSBOARDS?
Calculations derive a numeric value from votes using basic arithmetic. During an assessment, participants can choose from one of 5 Stages for each Capability.
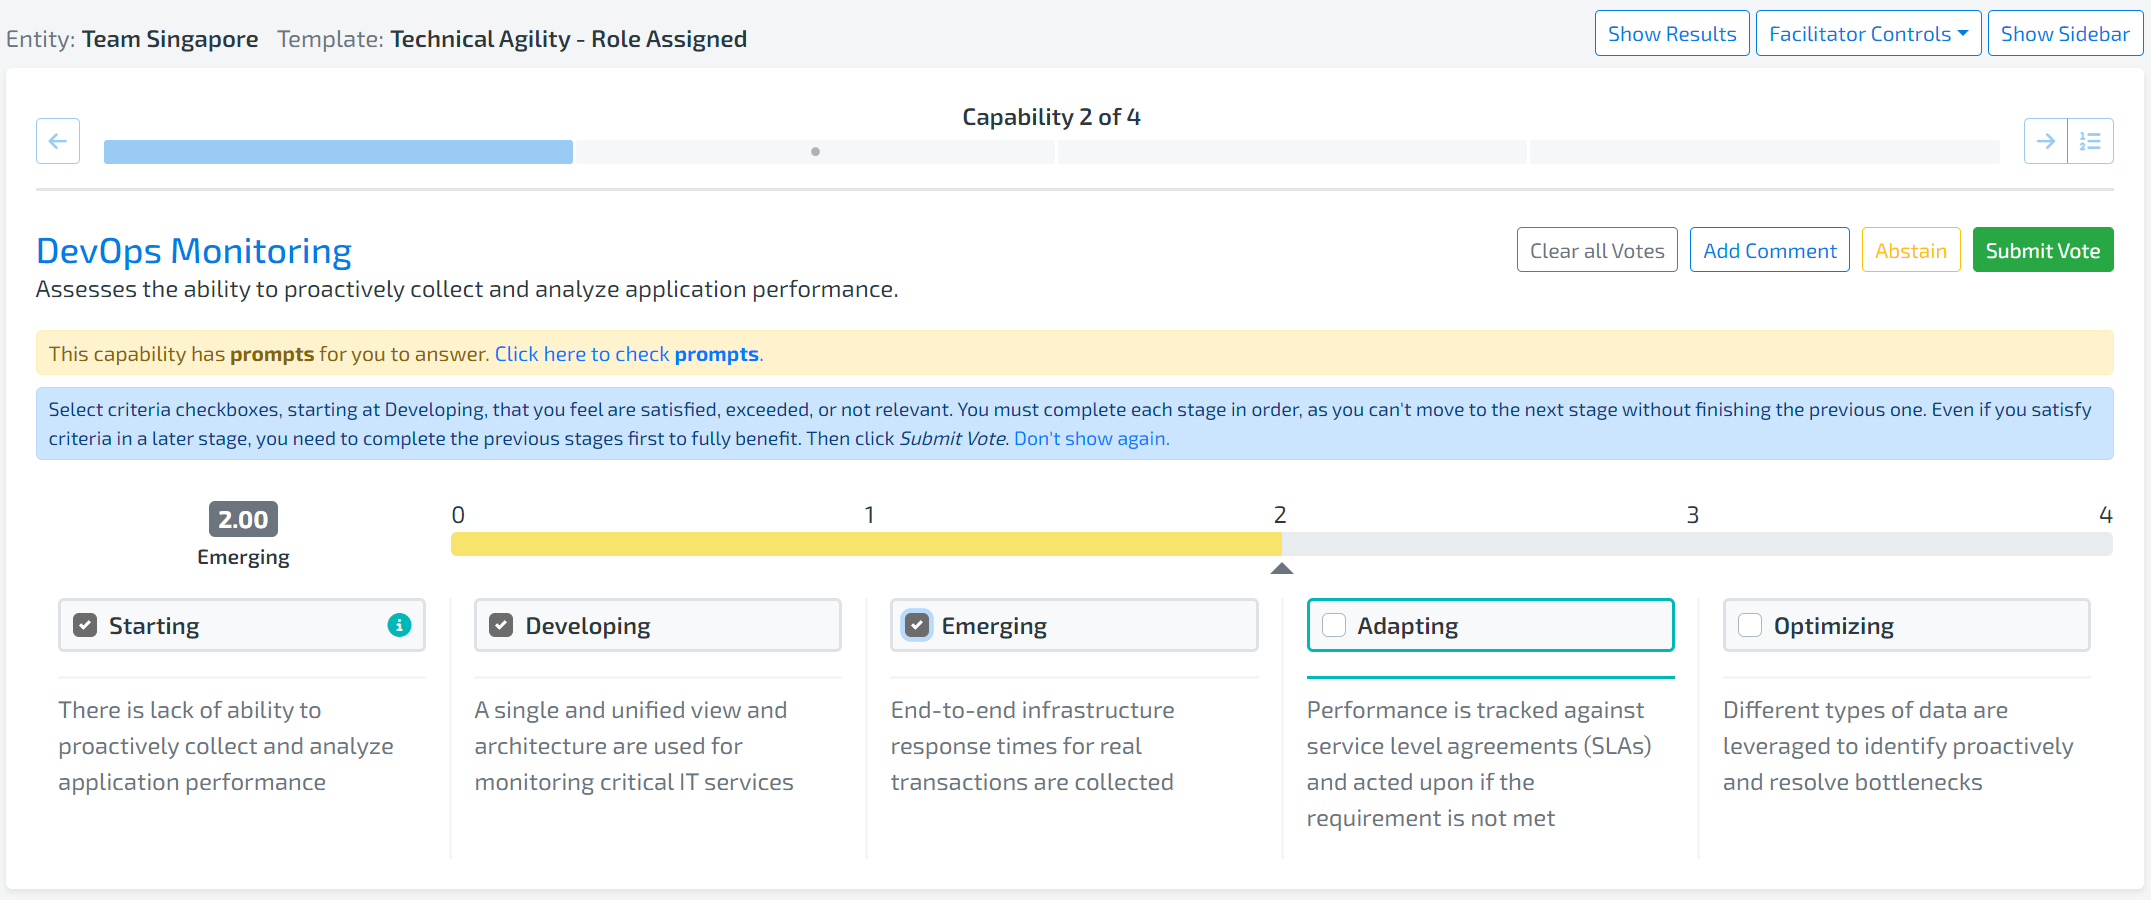
Each of these Stages maps to a numeric value according to the number following the word in the above screenshot. For example, Starting maps to 0 and Emerging maps to 2.
These numeric values are used to calculate an average on an entity/group/organization level that can be again mapped back to the Stages using the legend below.
Note: if the Organization Setting “Enable Partial Credit” is turned on, then votes can be partial values such as 2.5, 1.33, etc:
2.5 if all in Emerging is selected and half the criteria in Adapting are selected
1.33 if all in Developing are selected and 1/3 of the criteria in Emerging are selected.
etc.
Note: if your scoring ranges are different than below, you are grandfathered in to our old scoring model. Please contact us to transition to the new scoring model.

SCENARIO:
Consider a scenario where an entity took one assessment and in that assessment there were 3 Capabilities, 3 participants, and 1 facilitator.
Since the facilitator is there to facilitate and not to participate, the facilitator did not cast a vote for any of the capabilities. Therefore, there are only 3 votes per Capability to be considered for calculations.
| Capability | Votes |
|---|---|
| Learning | 2, 4, 1 |
| Team Stability | 0, 0, 3 |
| Agile Planning | 2, 4, 3 |
2. CAPABILITY RATING
HOW is the lean agile intelligence Capability rating calculated?
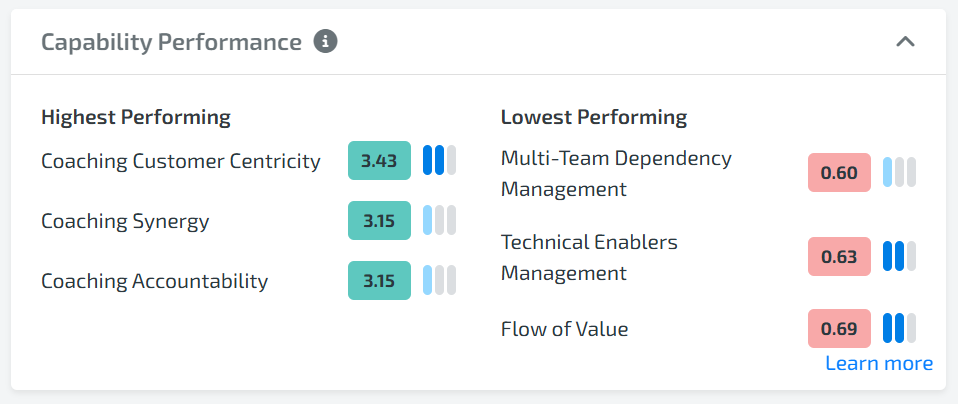
To get a Rating for a given Capability, the average of all votes received is calculated
Note: These values are displayed as dots and trend lines in the Insights Canvas and the Stage is available in the Insights Canvas drill down.
| Capability | Rating |
|---|---|
| Learning | (2+4+1)/3 = 2.33) |
| Team Stability | (0+0+3)/3 = 1 |
| Agile Planning | (2+4+3)/3 = 3 |
Overrides: During an assessment, there is an option to override the votes of the entity and choose a single vote.
In this case, the chosen override vote will replace each member’s vote for calculation purposes. For example, if 3 participants vote on a Capability and an override vote of Emerging is chosen, then those 3 original votes are converted into 3 votes of Emerging.
Group/Organization Level: At the Group and Organization level, all votes are averaged.
Note: It doesn’t matter how participants are distributed across the entities or groups
3. VOTE VARIABILITY
HOW is the lean agile intelligence Capability VOTE VARIABILITY calculated?
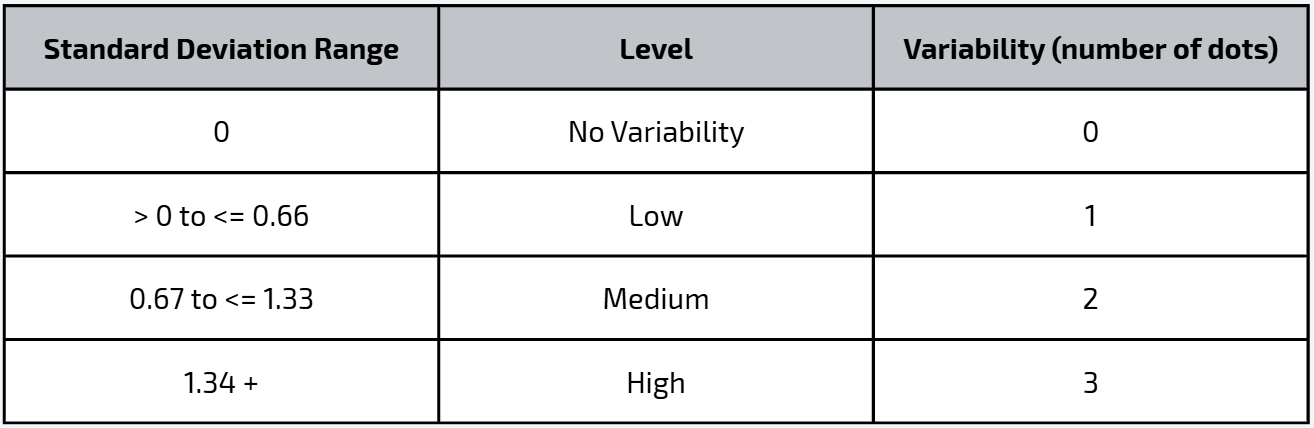
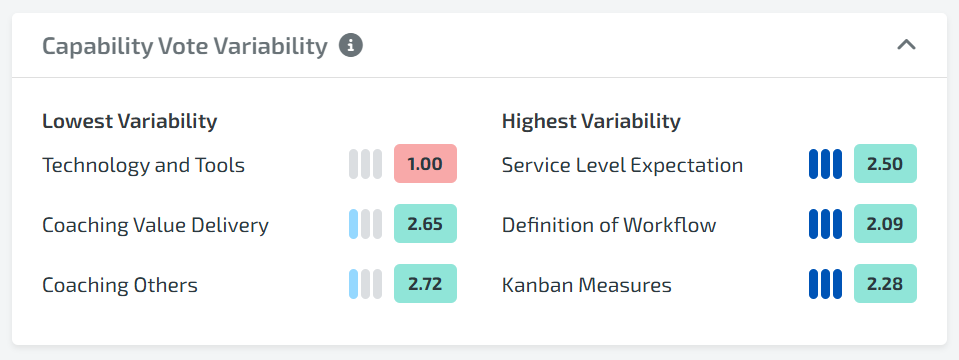
The variability for a given Capability is calculated as the population standard deviation of all votes being considered.
Standard deviation measures how spread out the votes are from the average (mean). A higher variability score indicates that votes are more spread out, which usually means there is more disagreement among voters. A lower variability score indicates that votes are more closely aligned.
For example, when the data follows a roughly normal distribution, about 68% of votes fall within one standard deviation above or below the average. This provides a useful way to understand how consistent or inconsistent the voting patterns are.
Group/Organization Level: At the Group and Organization level, all votes across all Entities are considered
Only one vote: If there is only one vote, then variability is not calculated and three gray dots (no variability) is shown.
4. MULTI-CAPABILITY
HOW is the lean agile intelligence entity/group rating calculated?
The Entity/Group Rating is the number that appears in the center of the Insights Canvas Capability Trends widget
This number is calculated by averaging the ratings from each Capability. So using the scenario above and averaging the nine votes gets a rating of 2.11
Group/Organization Level: At the Group and Organization level, all votes across all Entities are averaged
The same calculation methodology is applied to other multi-Capability aggregations. For example, Outcome Ratings, Dimension Ratings, etc.
5. CAPABILITY RATINGS
HOW is the lean agile intelligence Capability RATINGs calculated?
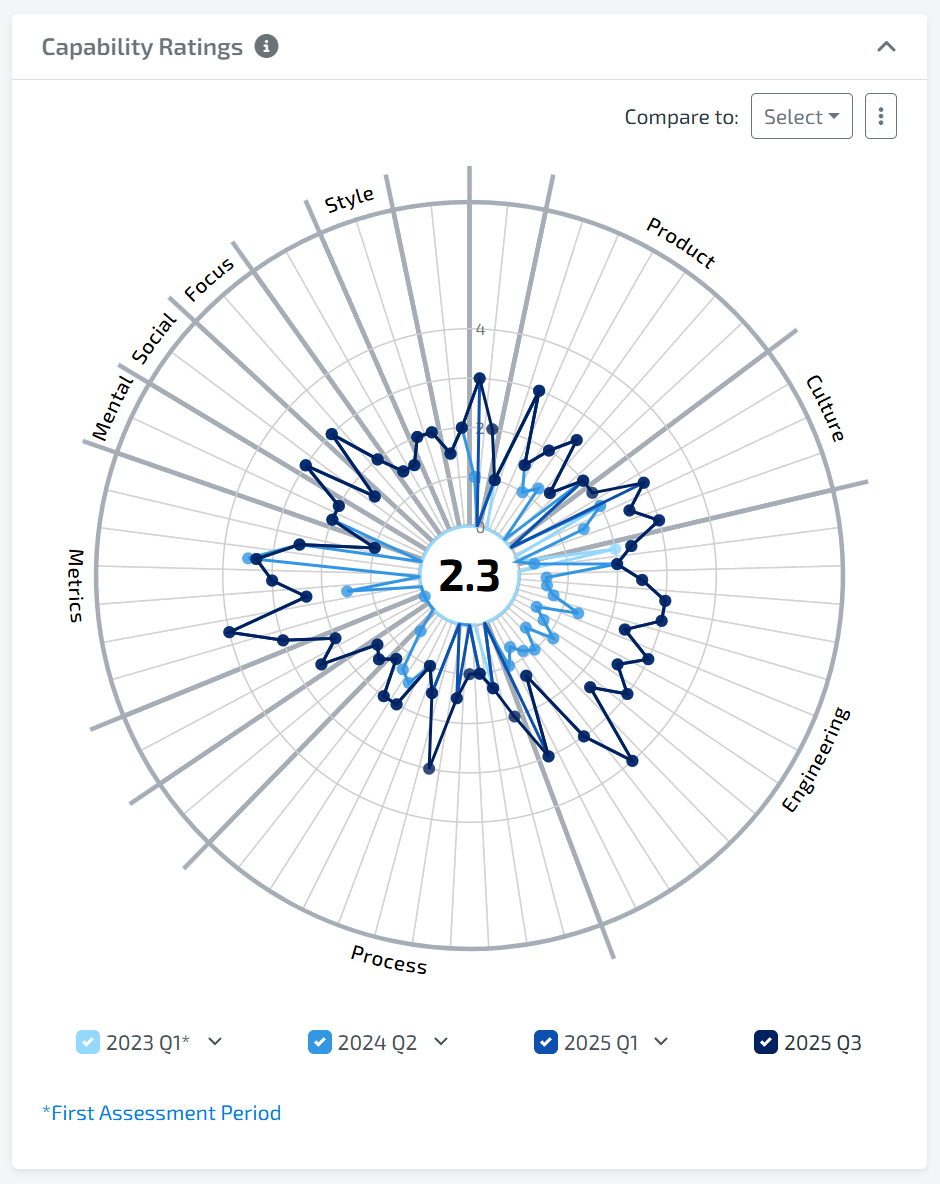
Trend lines are the lines that connect the per-Capability Rating dots on the Insights Canvas Capability Ratings Gadget. These trend lines behave differently depending on which level of the organization is being viewed.
ENTITY LEVEL
The objective (default) of LAI trend lines is to show the incremental improvement from
First Assessment to Latest Assessment
Previous Assessment to Latest Assessment
Previous-Previous Assessment to Latest Assessment
This approach shows how much improvement has been captured since the first assessment, and how the team is trending in its last three assessments.
Additional Details
A maximum of four trend lines are shown.
For Entities, the trend lines are the date of the very first assessment taken and the dates of the three most recent assessments taken.
Note: if the Show Trends as Quarters organization setting is enabled, then the trends will be calendar quarters instead of dates. See the Group/Organization Level below for an explanation of how bucketing into calendar quarters works.
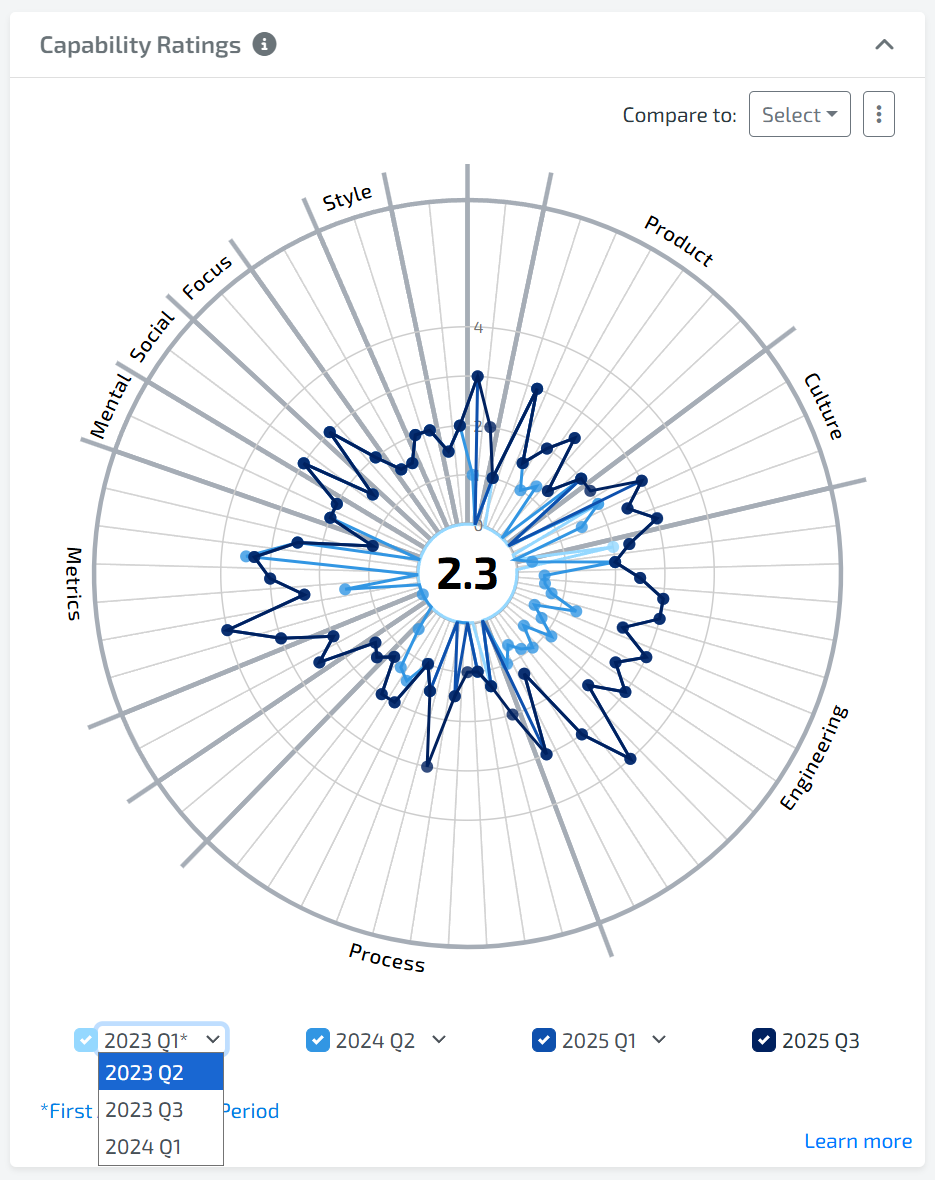
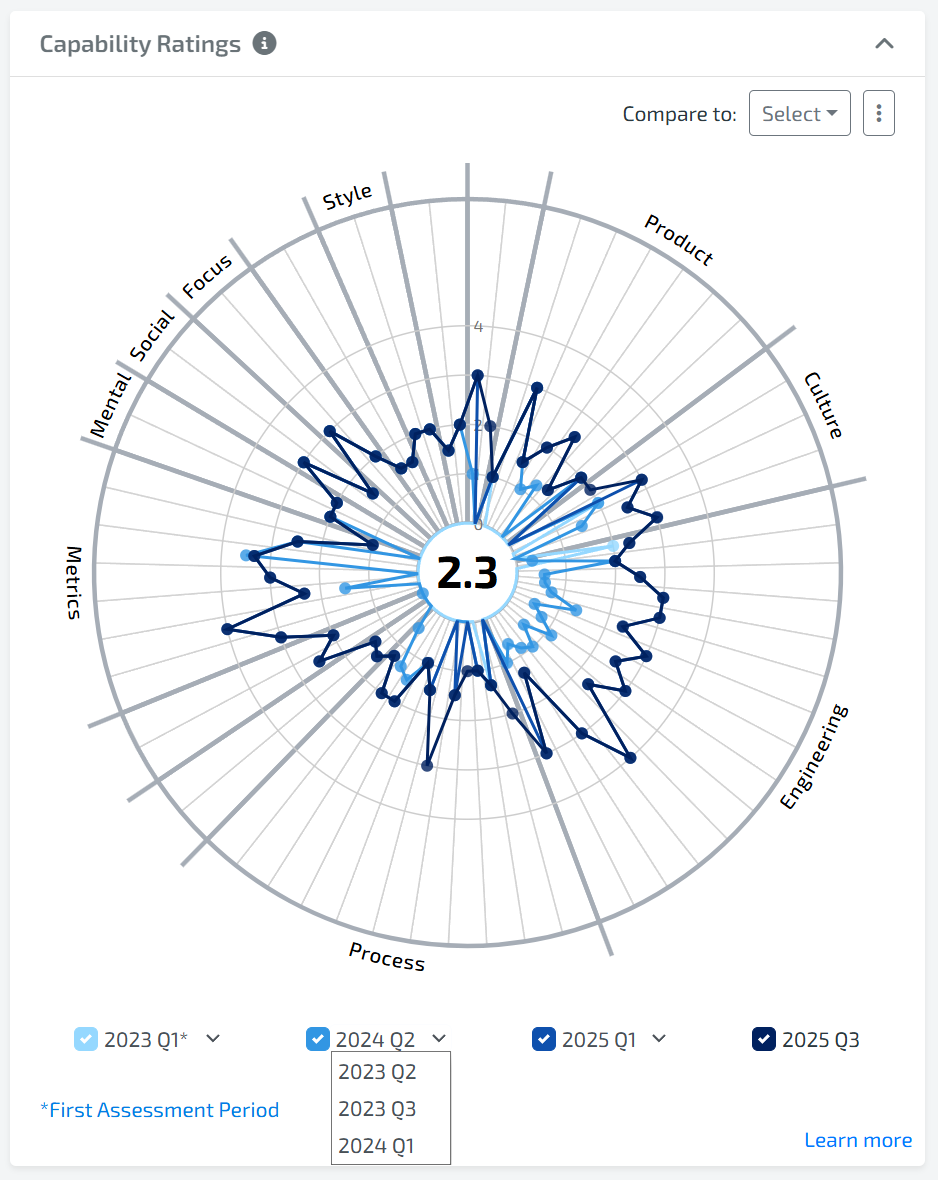
However, if there are more than 4 assessment trend lines available, the trend lines displayed can be changed by selecting the time period in the dropdown beside each trend line label.
The trend lines show the latest Rating for each Capability that is on or before the trend line date.
The first assessment trend line is displayed so you are able to measure the amount of improvement seen since the first assessment baseline was established. The three most recent assessments allow you to see the most recent changes.
Examples
A team took 2 assessments on 7/6/2020, 3/4/2020
Trend lines: 7/6/2020, 3/4/2020
A team four took assessments on 7/6/2020, 3/4/2020, 11/15/2019, and 6/4/2019.
Trend lines: 7/6/2020, 3/4/2020, 11/15/2019, and 6/4/2019
A team took six assessments: 7/6/2020, 7/5/2020, 7/4/2020, 7/3/2020, 7/2/2020, 7/1/2020.
Trend lines: 7/6/2020, 7/5/2020, 7/4/2020, 7/1/2020
Note: Because there are more than 4, you have the option to swap one of the 4 default trend lines to show the 7/3/2020 or 7/2/2020 assessments.
Group/Organization LEVEL
The objective of LAI group trend lines in our dashboards is to show incremental improvements for different periods of time. LAI focuses on three improvement periods:
First Assessment to Latest Assessment
Previous Assessment in a prior calendar quarter to Latest Assessment
Previous Assessment in the prior calendar year to Latest Assessment
To achieve those objectives the following approach has been adopted.
Each team's first assessment is bucketed into the first assessment line.
The subsequent trend lines represent the latest assessment taken by the team "As of" the specified quarter.
This approach allows you to compare the first assessment (of all teams) to the different points in time (quarters) at every level of the organization
We have learned this is the best way to show trends given the variability of frequency that teams take assessments in different organizations
It would be misleading to compare two trend lines with differing numbers of teams - Q3 with 20 teams and Q4 with 10 teams just because 10 of those teams did not take an assessment in Q4
Instead, we show the aggregate of all team's first assessment and how their latest assessment aggregate has changed over points in time
The “First Assessment” Trend line for Groups can be turned on or off in the Account screen “Show First Assessment Trend” setting. If turned off, the trend line is replaced with the first calendar quarter that any Results were calculated.
While the “First Assessment” trend line looks forward to capture the score for every capability-entity pair, the first calendar quarter will look backwards in time to capture the latest capability-entity pair in the first quarter that Results were captured.
Additional Details
A maximum of four trend lines is displayed
The default four trend lines are displayed/not displayed in the following order:
First Assessment – Include the first assessment taken for each entity, regardless of date the assessment was taken.
This trend line is always labeled as ‘First Assessment’
Last Assessment – Include the latest assessment taken for each entity, regardless of the date the assessment was taken
If this is the same data as ‘First Assessment’ then do not show the trend line. Label it as the latest calendar quarter a response was received (for example, 2020 Q3).
Previous Quarter Assessment – Include the latest assessment taken for each entity that has a latest date of the last day of the calendar quarter before Last Assessment.
If this is the same data as ‘First Assessment’ or ‘Last Assessment’ then do not show the trend line. Label it as the latest calendar quarter a response was received.
Previous Previous Quarter Assessment – Include the latest assessment taken for each entity that has a latest date of the last day of the calendar quarter before Previous Quarter Assessment.
If this is the same data as First Assessment or Last Assessment or Previous Quarter Assessment then do not show the trend line. Label it as the latest calendar quarter a response was received.
Etc. (more trends) - we support up to 12 trend lines so other periods are updated
The First Assessment trend line is displayed so you are able to measure the amount of improvement seen since the First Assessment baseline was established.
The Last Assessment trend line shows the latest responses to know where you are today.
The Previous Quarter and Last Year assessments provide a good representation of recent improvements.
Note: The trend lines displayed in the Capability Trends can be changed if more data are available. To change the trend line being displayed, select the time period to display next to the trend line label.
Examples (‘Show First Assessment Trend” on)
A group of 3 entities – each entity took one assessment on 3 different dates – 7/4/2020, 5/4/2020, 11/12/2019.
Trend lines: First Assessment
A group of 3 teams – two teams took one assessment – 7/4/2020, 5/4/2020, the other one team took two assessments – 7/3/2020, 5/12/2020.
Trend lines: First Assessment, 2020 Q2, 2020 Q3
A group of 3 teams – two teams took one assessment – 7/4/2020, 3/4/2020, one team took two assessments – 7/6/2020, 1/4/2020.
Trend lines: First Assessment, 2020 Q1, 2020 Q3
A group of 3 teams that took assessments for every quarter in 2020 and every quarter in 2019.
Trend lines: First Assessment, 2019 Q4, 2020 Q3, 2020 Q4
A group of 3 teams that took assessments for 2020 Q1 and every quarter in 2019.
Trend lines: First Assessment, 2019 Q4, 2020 Q1
how is the Raw Point Value increase/decrease calculated?
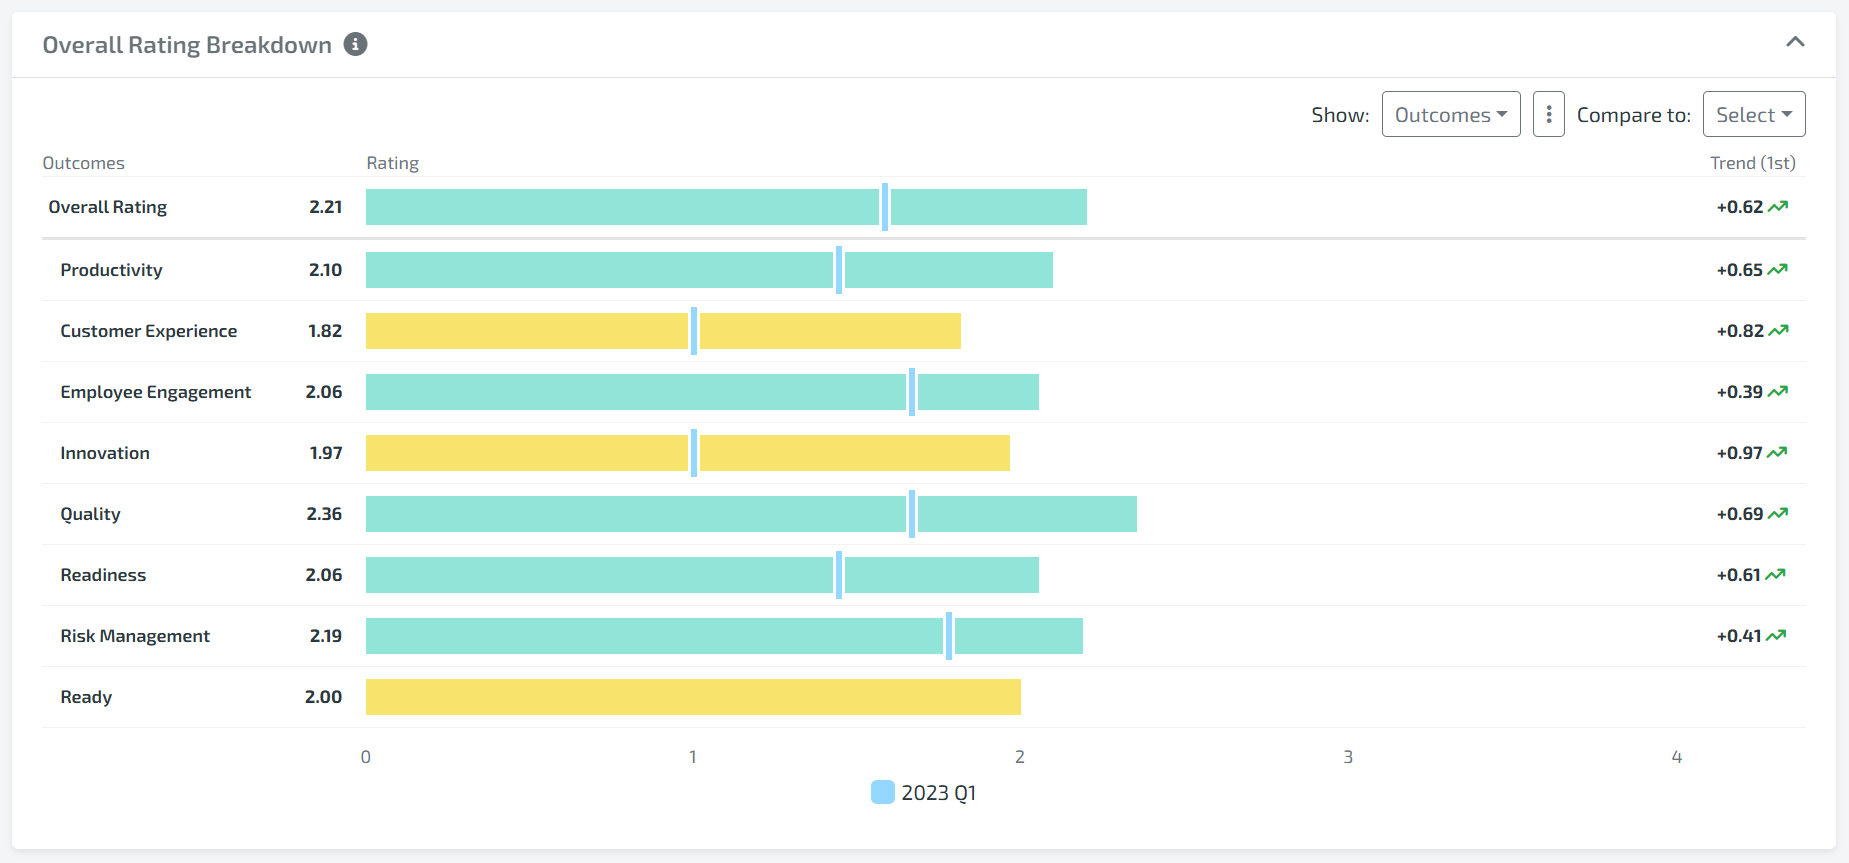
In some of our dashboards, we display a Trend arrow with an accompanying raw point value.
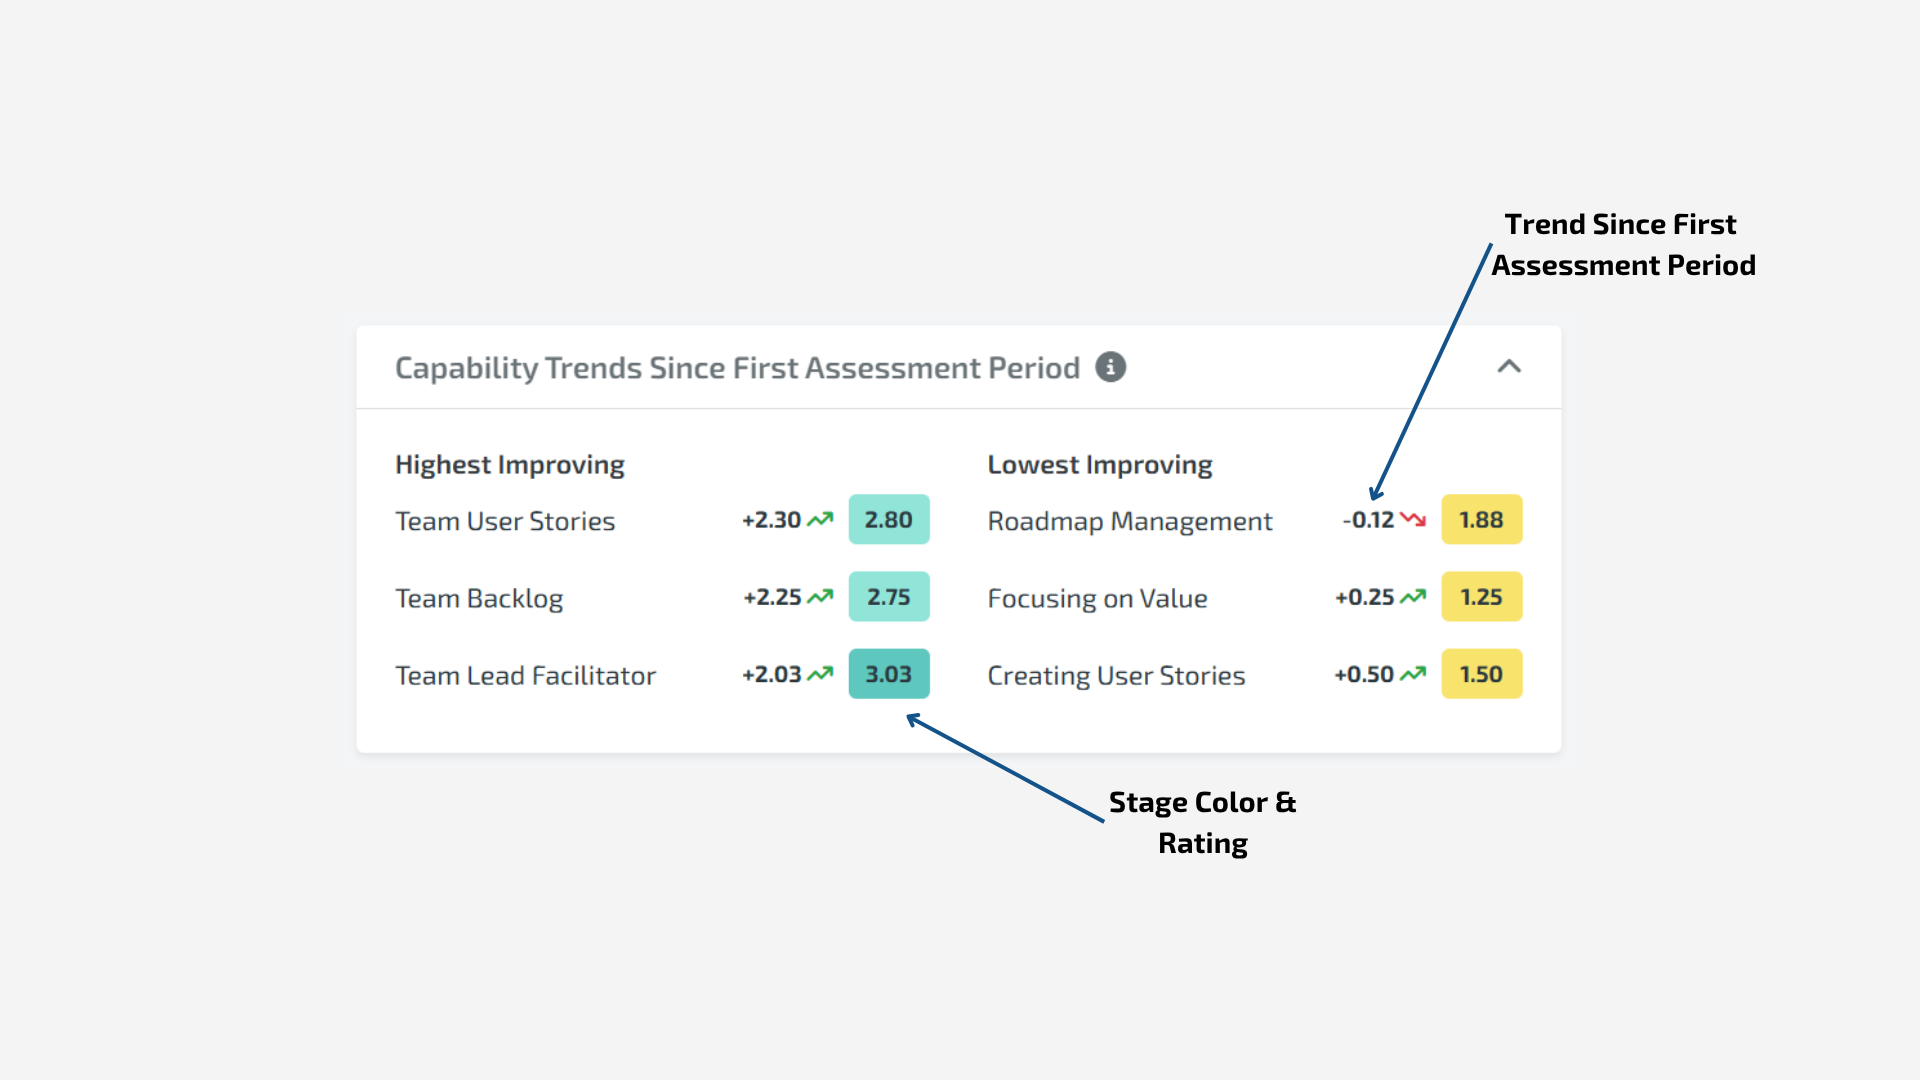
For example, the Rating Trend above has a raw point value followed by an arrow.
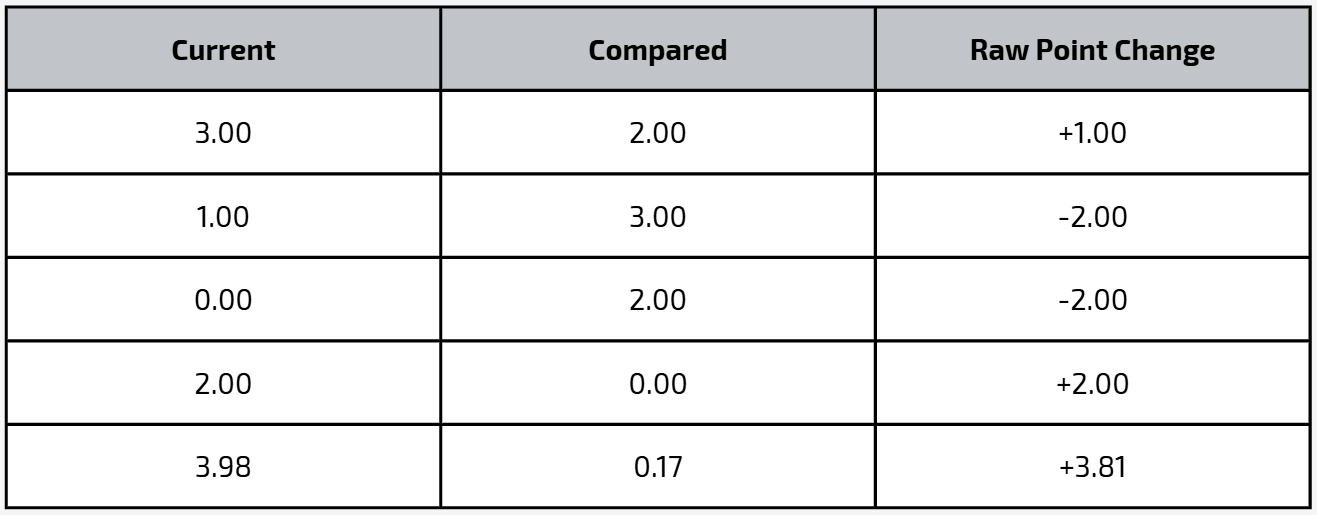
Trend Direction
The direction of the change is determined by comparing the current Rating to the previous Rating:
Positive change (
+)
When the current Rating is greater than the compared RatingNo change (
+0.00)
When the current Rating is equal to the compared RatingNegative change (
-)
When the current Rating is less than the compared Rating
If no compared Rating exists, no change value is shown.
Arrow Direction
The Arrow direction can be determined by the following:
Up Arrow - If the Rating is greater than the compared Trend’s Rating
Right Arrow - If the Rating is equal to the compared Trend’s Rating
Down Arrow - If the Rating is less than the compared Trend’s Rating
No Arrow - If no compared Trend exists
The raw point value is calculated using this formula:
Current Rating − Compared Rating
The result is displayed as a signed value using two decimal places.
6. OUTCOMES RATING
HOW is the lean agile intelligence OUTCOME RATING calculated?
The Outcome Rating is calculated the same way as the Overall Average except that only Capabilities that are linked to the Outcome are included. Below is a list of the three Capabilities and their linked Outcomes.
| Capability | Outcomes |
|---|---|
| Learning | Employee Satisfaction, Innovation |
| Team Stability | Time to Market, Customer Satisfaction, Employee Satisfaction, Innovation, Reliability, Responsiveness, Predictability |
| Agile Planning | Time to Market, Customer Satisfaction, Responsiveness, Predictability |
Also, remember the averages per Capability that were calculated. Here they are for reference:
| Capability | Votes |
|---|---|
| Learning | 2, 4, 1 |
| Team Stability | 0, 0, 3 |
| Agile Planning | 2, 4, 3 |
To calculate the Time to Market Outcome Rating, average all Capabilities linked to Time to Market, which is Team Stability and Agile Planning. The table below shows the results for some Outcomes.
| Outcome | Rating (Average) |
|---|---|
| Time to Market | (1+3)/2 = 2 |
| Reliability | 1 |
Group/Organization level
At the group and organization level, all votes across all entities are averaged.