
Article Contents
Results Information
Summary
Overall Rating Breakdown
Direct Descendants Heatmap
CAPABILITY Ratings
Capability Performance
Capability Vote Variability
Capability Recommendations
Capability Trends Since Previous AssessmenT Period
Capability Trends Since First AssessmenT Period
Top Capabilities By Closed Improvement Actions (IAs)
Top Capabilities Marked for Improvement
Metrics
Group HEATMAP
CAPABILITY Details
Dimension Trends
Outcome Trends
Improvement Actions Details
1. RESULTS INFORMATION
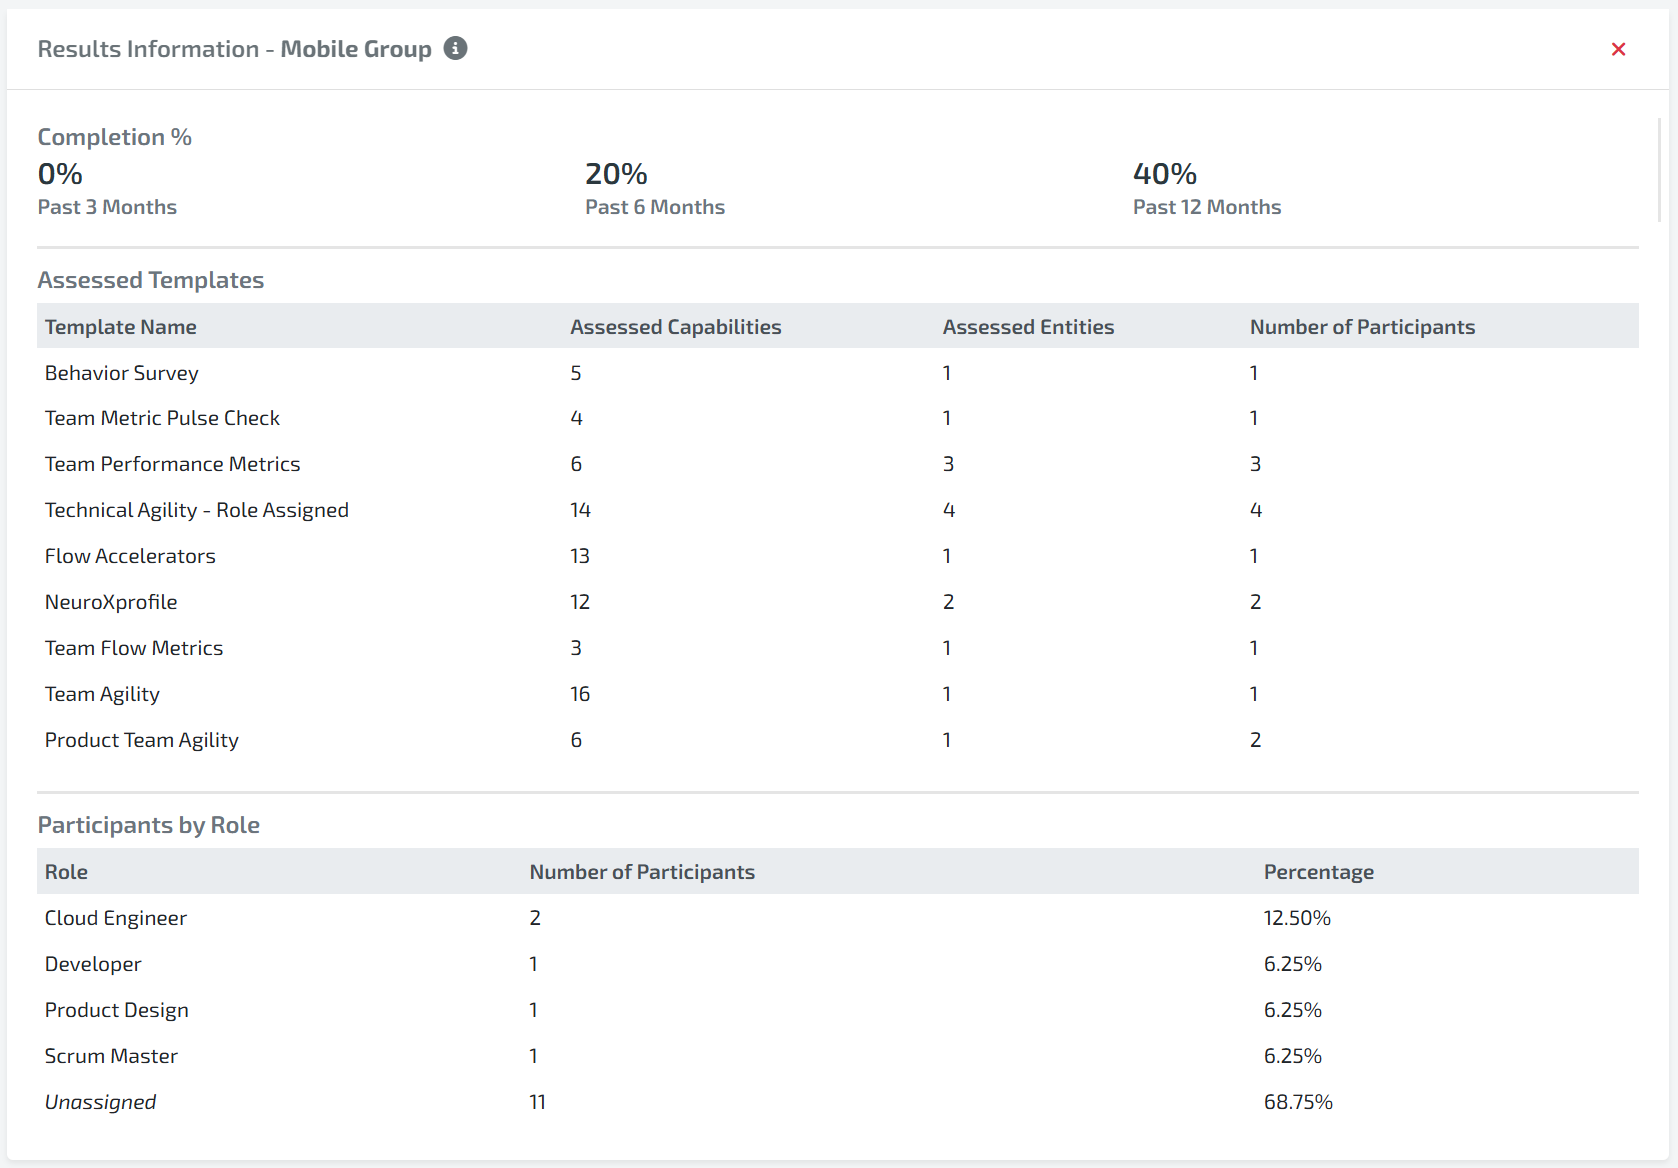
What is the Results information widget?
The Results Information widget provides an overview of the data used in calculating the Results page and various assessment statistics, including assessment completion percentages, the last assessment date, the template name, the total number of assessed capabilities and entities, and the total number of participants.
components
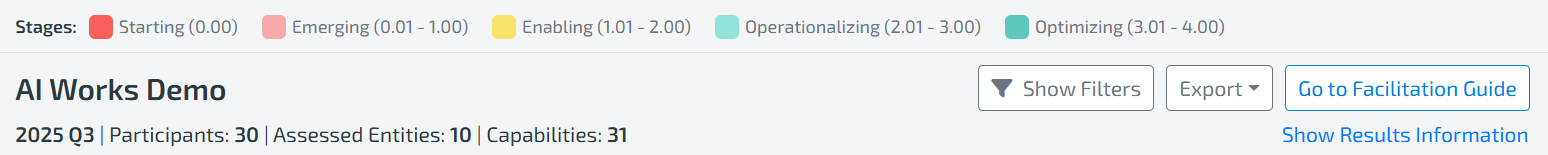
Summary row below dashboard header
Time Period: The latest time period used to determine which assessment data is included in the Results calculations.
Participants: The total number of participants who submitted votes in the assessments included in the Results calculations.
Assessed Entities: The total number of Entities included in the assessments used to calculate the Results. Not shown for an Entity since the value would always be 1.
Capabilities: The total number of Capabilities assessed in the assessments included in the Results calculations.
Show/Hide Results Information: Toggle for showing/hiding the Results Information widget in the dashboard.
Completion %: The percentage of Entities that completed an Assessment within the given time frame. At the Entity level, this part is hidden because it would always be either 0% or 100% because there is only one Entity.. But at the Group and Organization level, this considers all Entities within the Group or Organization. This shows how current the data is for the selected Entity or Group.
Examples (if today’s’ date is 6/15/2022)
Past 3 Months = 0% - no Entities in the Group completed an assessment
between 3/15/2022 to 6/15/2022
Past 6 Months = 50% - half of the Entities in the Group completed at least one assessment
between 12/15/2021 to 6/15/2022
Past 12 Months = 100% - all the Entities in the Group completed at least one assessment
between 6/15/2021 to 6/15/2022
Note that the calculation excludes Entities who have completed no assessments
Note that the Completion % is hidden when viewing Results for an Entity. It only appears when viewing Results for a Group or Organization.
Last Facilitator: The facilitator of the Last Assessment. Only available at the Entity level.
Assessed Templates: All the assessment templates used in the calculation of the Results Page.
Template Name: The name of the assessment template.
Last Date Completed: The completed date of the last assessment for this template. Only available at the Entity level.
Assessed Capabilities: The number of Capabilities that are shown in Results for this template.
Assessed Entities: The number of Entities that have completed the an assessment for the template. Only available at the Group and Organization level.
Number of Participants: The number of participants that completed the last assessment for the template.
Participants By Member Attribute Tables: All participants group by different member attribute values that are available
Attribute Value: The name of the member attribute value.
Number of Participants: The number of participants that completed the assessments included in the calculation of Results per attribute value.
Percentage: The percentage of participants that completed the assessments included in the calculation of Results per attribute value.
2. SUMMARY
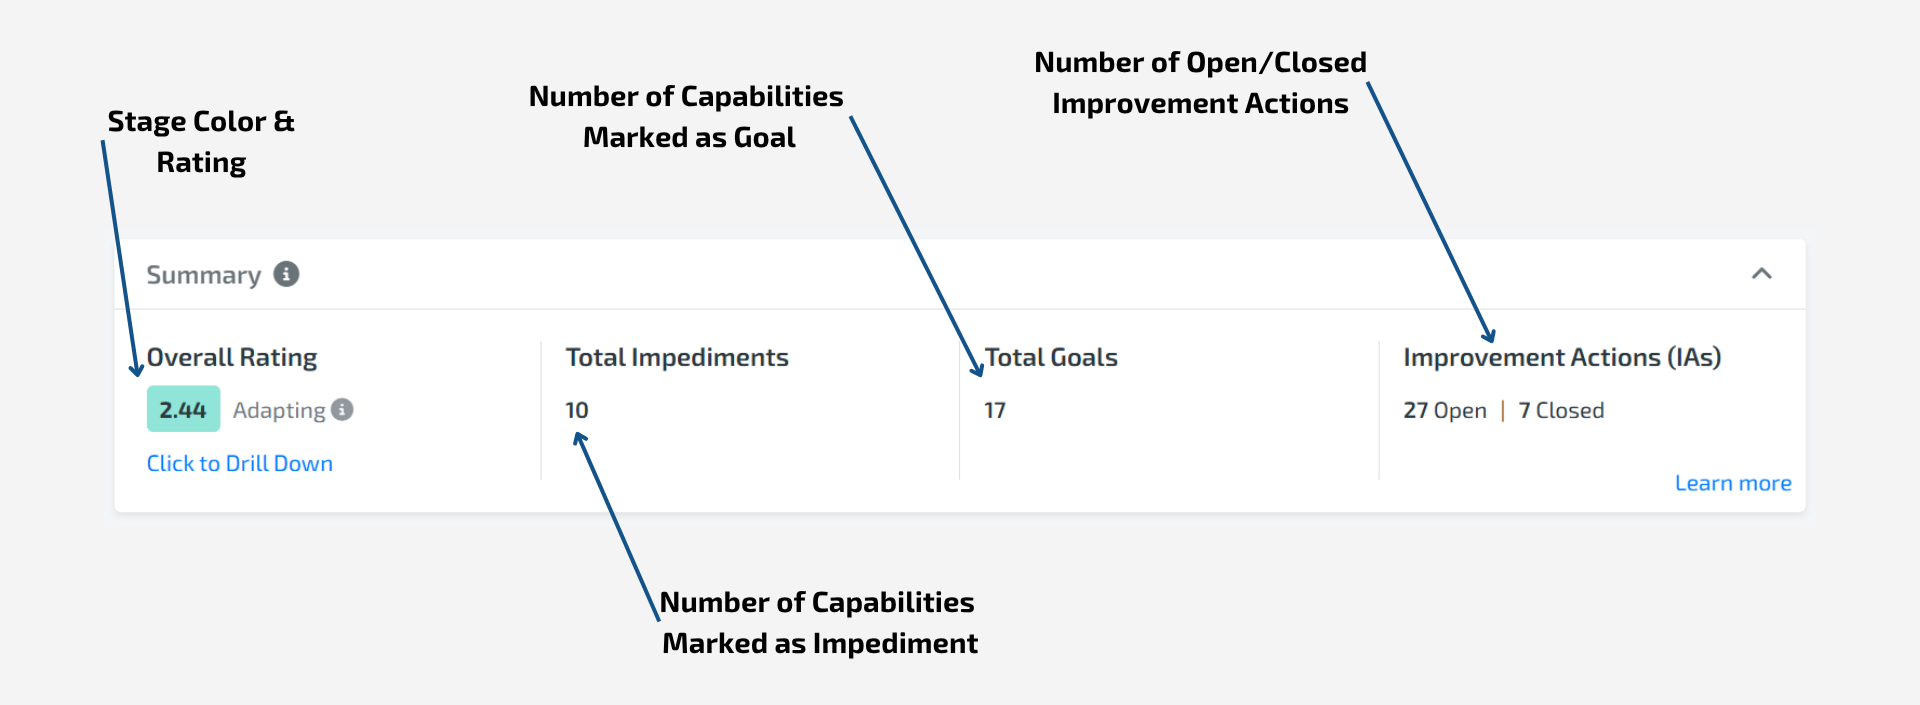
What is the Summary widget?
The Summary widget provides a simple one-stop-shop overview that provides details like the Entity/Group Rating, the Entity/Group Rating Trend, and total current Impediment and Goal counts.
components
Overall Rating: The aggregate average Rating for all assessed Capabilities for the latest Trend, truncated to 2 decimals. Uses the legend at the top of the dashboard to translate the Rating to a Stage color for the background.
Click to Drill Down link: Click this to launch the Entity/Group Rating Drilldown screen
Total Impediments: The sum of the total number of capabilities marked as Impediment for each Entity in the Entity/Group/Organization.
Total Goals: The sum of the total number of capabilities marked as Goal for each Entity in the Entity/Group/Organization.
Improvement Actions (IAs): The sum of the total number of Improvement Actions that are open (active) and closed.
3. OVERALL RATING BREAKDOWN
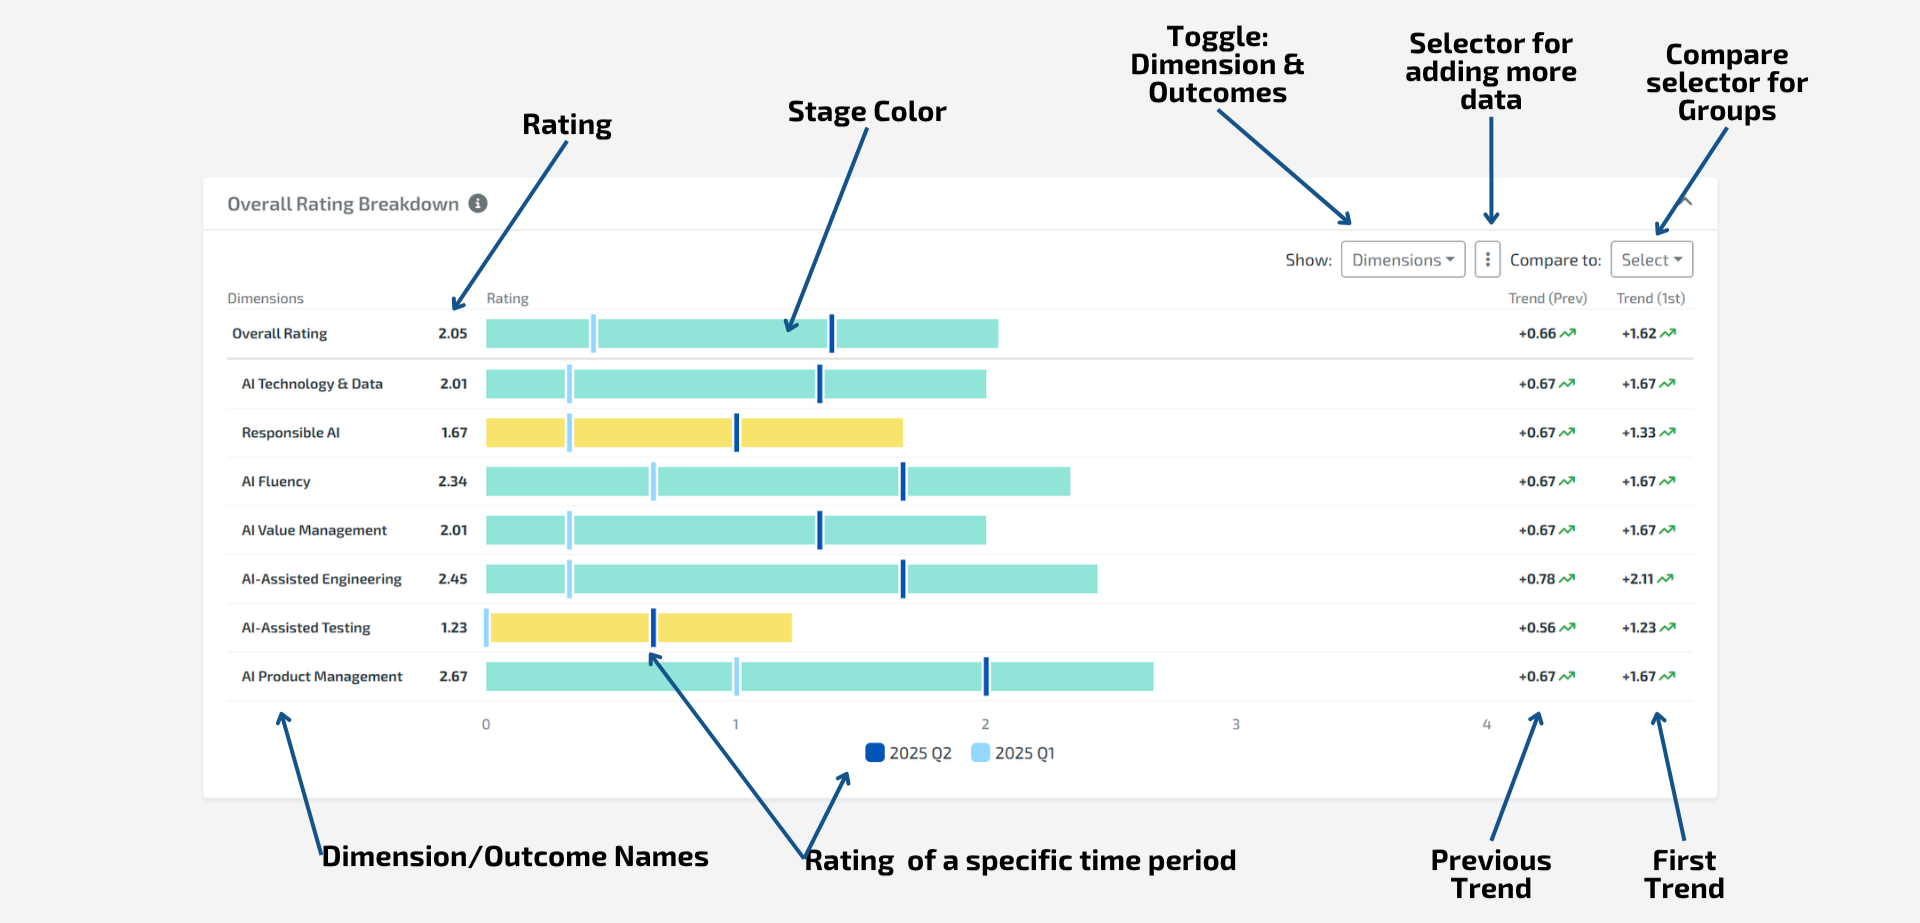
What is the Overall Rating Breakdown widget?
The Overall Rating Breakdown widget provides a breakdown of the overall rating by dimension or outcome.
components
Dimension/Outcome Name: Name of the Dimension or Outcome. Top row reserved for the Overall Rating.
Note: Dimensions and Outcomes are displayed in the same order as the Dimensions and Outcomes pages, respectively.
Rating: The aggregate average Rating for each Dimension/Outcome for the latest result, truncated to 2 decimals.
Rating bar: Uses the legend at the top of the dashboard to translate the Rating to a Stage color.
Toggle: Click this switch between viewing Dimensions or Outcomes.
Selector for adding more data: Allow you to add up to two more columns of data in the Overall Rating Breakdown
Trend (Prev): A comparison between the previous Trend and the current Trend. When hovering, this displays the previous Trend’s Stage and Rating for the Dimension/Outcome, truncated to 2 decimals.
Rating Trend: A comparison between the previous Trend and the current Trend. When hovering, this displays the previous Trend’s Stage and Rating.
Up Arrow - If the Rating is greater than the previous Trend’s Rating
Right Arrow - If the Rating is equal to the previous Trend’s Rating
Down Arrow - If the Rating is less than the previous Trend’s Rating
No Arrow - If no previous Trend exists
Also displays the previous Trend value on each Rating bar
Trend (1st): A comparison between the first Trend and the current Trend. When hovering, this displays the first Trend’s Stage and Rating for the Dimension/Outcome, truncated to 2 decimals.
Rating Trend: A comparison between the first Trend and the current Trend. When hovering, this displays the first Trend’s Stage and Rating.
Up Arrow - If the Rating is greater than the first Trend’s Rating
Right Arrow - If the Rating is equal to the first Trend’s Rating
Down Arrow - If the Rating is less than the first Trend’s Rating
No Arrow - If no first Trend exists
Also displays the first Trend value on each Rating bar
Total Goals: The sum of the total number of capabilities marked as Goal for each Dimension/Outcome.
Total Impediments: The sum of the total number of capabilities marked as Impediment for each Dimension/Outcome.
Open IAs: The sum of the total number of open Improvement Actions for each Dimension/Outcome.
Closed IAs: The sum of the total number of closed Improvement Actions for each Dimension/Outcome.
Compare to Group/Organization: The Group or Organization to include in the Capability/Trend Ratings
Comparison mode is only available at the Entity and Group levels.
Only the Groups that the member has permission to view will be available to select
4. DIRECT DESCENDANTS HEATMAP
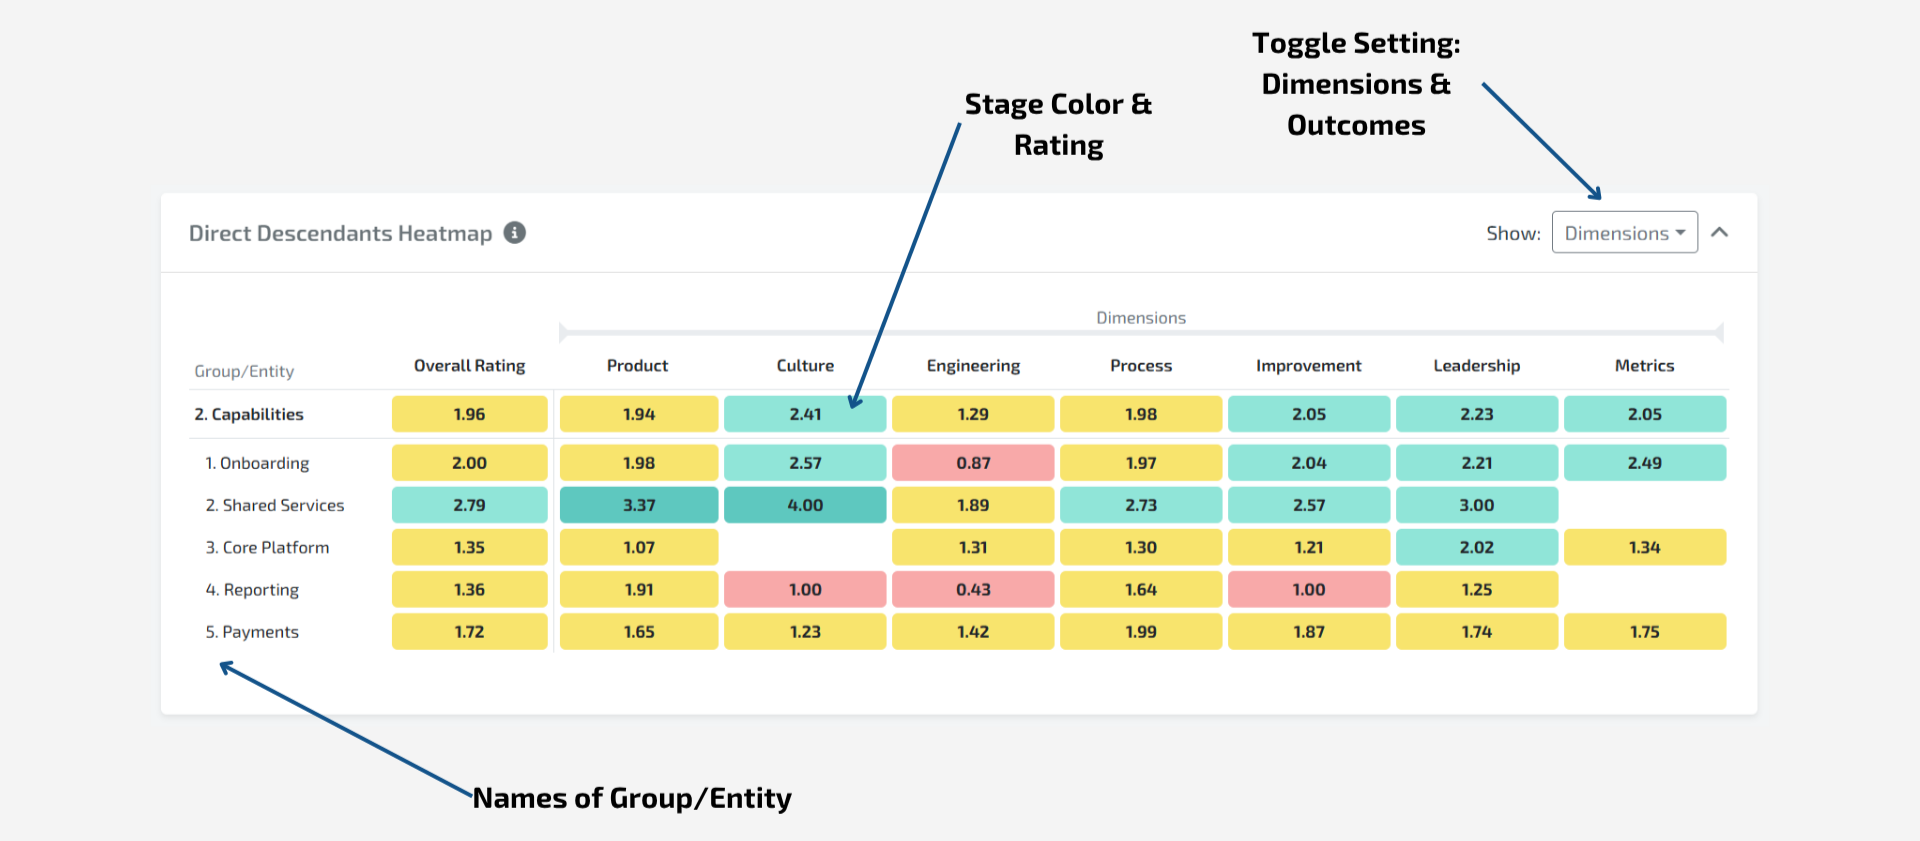
What is the Direct descendants heatmap widget?
The Direct Descendants Heatmap widget provides a view of many Entities/Groups that are direct descendants of the Group/Organization at once and visually find patterns in all types of different metrics. It is a super-flexible widget that allows aggregation via Dimension or Outcome.
Note: this widget will not appear when selected on an Entity, since Entities have no descendants.
components
Group/Entity: The currently-selected Organization/Group at the top and all direct descendant Entities and Groups below, ordered by Entities alphabetically, then Groups alphabetically.
Overall Rating: The aggregate average Rating for all assessed Capabilities for the latest Trend, truncated to 2 decimals. Uses the legend at the top of the dashboard to translate the Rating to a Stage color.
Dimension/Outcome columns: Each Dimension or Outcome (depending on toggle) ordered by the same order as the Dimensions and Outcomes page, respectively, showing the Rating for each Group/Entity.
Show Toggle: Click this switch between viewing Dimensions or Outcomes.
5. CAPABILITY RATINGS
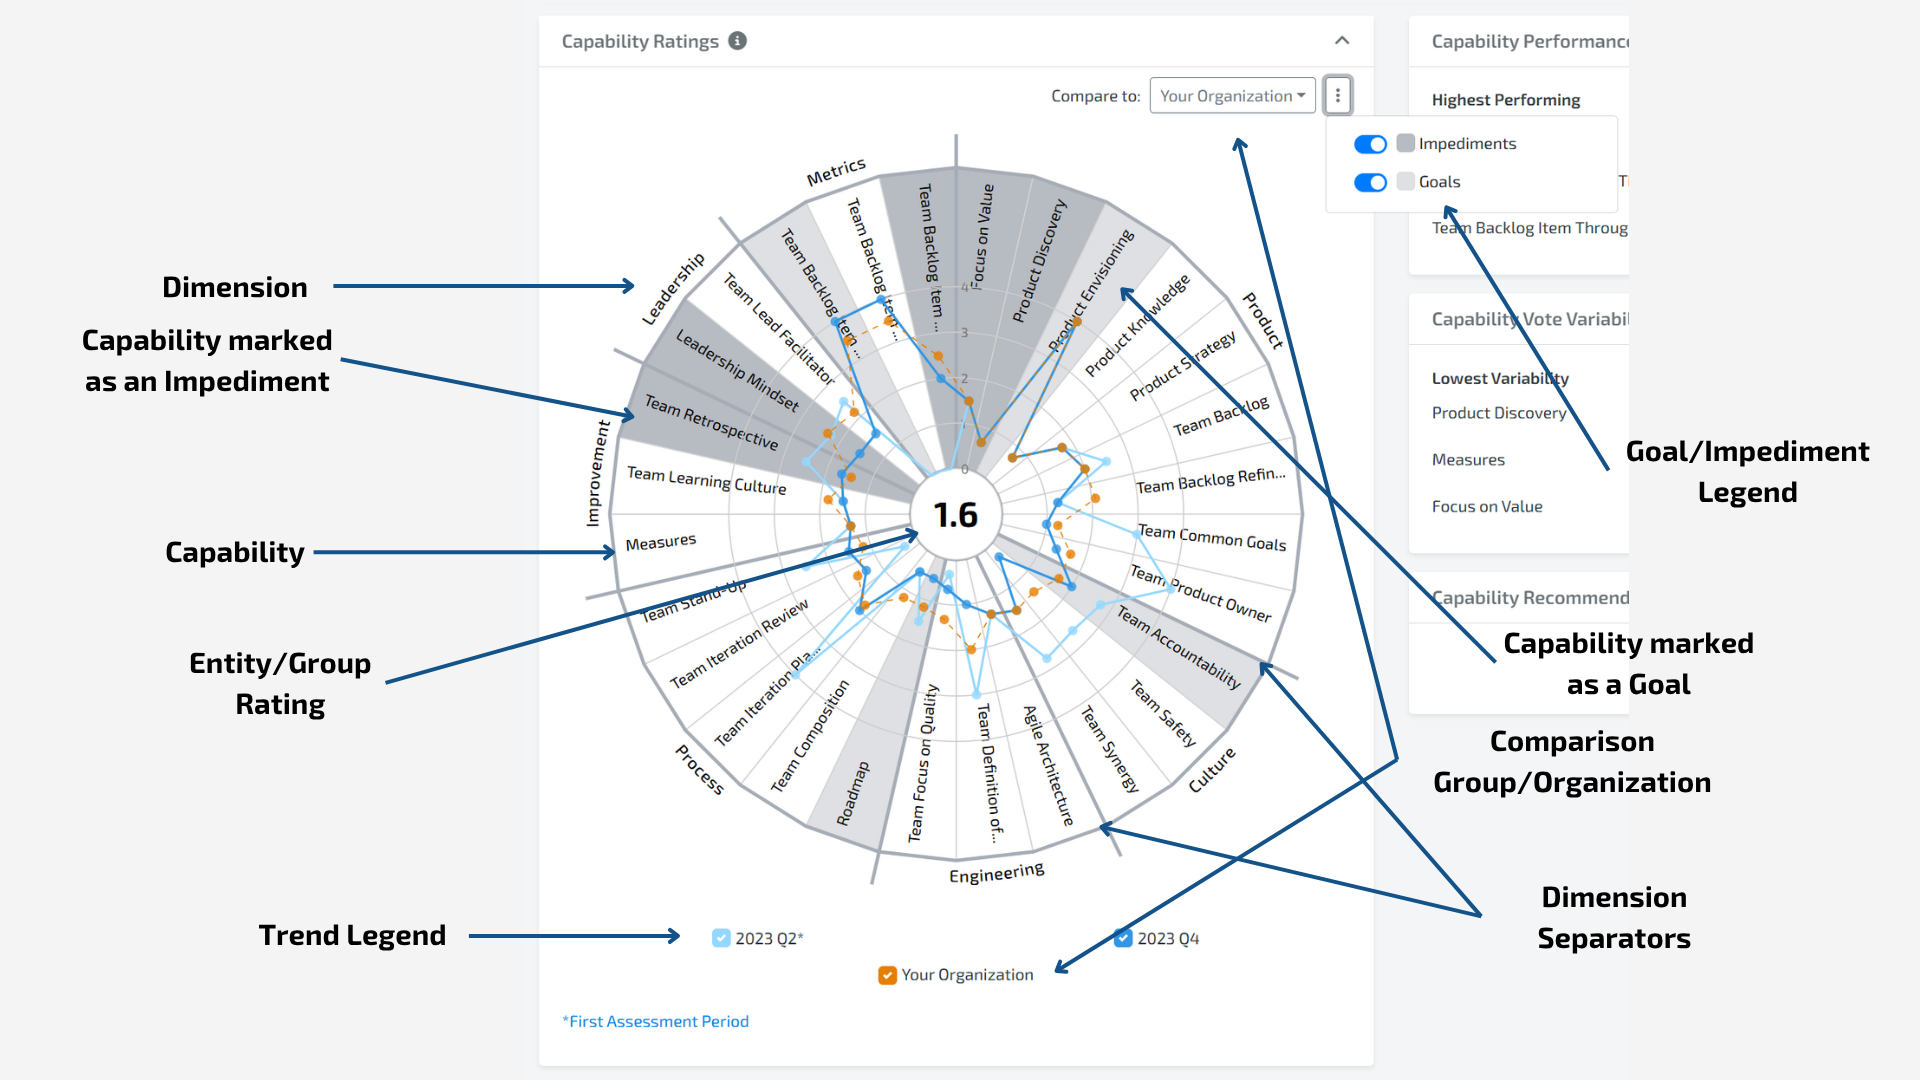
What IS THE Capability RATINGs widget?
The Capability Ratings widget is a combination visual tool allowing for a detailed Results overview
All assessed Capabilities are displayed as a pie chart grouped by their Dimension
Capabilities are labeled as Goals or Impediments - allowing you to visually see how many and which Capabilities are a Goal or Impediment.
The Rating for each Capability and Trend combination plotted as a distance from the center
The Entity/Group Rating in the center
The Capabilities are ordered clockwise starting at 12 o’clock
If only one template: by template order.
If more than one template: by Dimension and then alphabetically.
components
Capabilities: All assessed Capabilities are displayed, grouped by Dimension
If there are more than 40 Capabilities displayed, the Capability Name will be omitted, due to a lack of space.
Entity/Group Rating: The aggregate average Rating of all assessed Capabilities, truncated to 1 decimal.
Goal/Impediment: Capabilities are labeled using the color from the legend
The Capability is marked as a Goal/Impediment if at least one team has marked the Capability as an Impediment or Goal as of the most recent Trend for each team.
Check and uncheck the Goal or Impediment legend to hide or show the Goal and Impediments on each Capability
If a team marked a Capability as a Goal on 9/16/2020 and then did not mark the same Capability as a Goal on the 1/13/2021 Assessment, then the Capability is not considered a Goal anymore and will not be marked.
If a Capability is marked as both a Goal and an Impediment, then the total number of Goals is compared to the total number of Impediments and the higher one determines the color. In the event of a tie, the Impediment color is used.
To find out which teams marked the Item as a Goal or Impediment, hover over the Capability.
Capability/Trend Ratings: Each Capability Rating is the corresponding dot in the Capability pie slice. To find out which Trend it is for, match the color of the dot to the Trend legend.
If there is no dot for a Capability and the connecting line goes down to the center, then the team was not assessed on that Capability for that Trend.
The Trends are displayed with the most recent Trends on top. This means the most recent Trends could hide parts or all of previous Trends.
Trends can be checked/unchecked to show/hide them, allowing you to focus on just the trends you are interested in.
Compare to Group/Organization: The Group or Organization to include in the Capability/Trend Ratings
Comparison mode is only available at the Entity and Group levels.
Only the Groups that the member has permission to view will be available to select
If comparison mode is used, the latest Trend for the compared Group or compared Organization is used.
If the compared Group or Organization has no Trends, then no Trends will be displayed.
By default, only the latest Trend from the Entity is selected for display. However, you can check/uncheck the Trends to show/hide all Trends.
Note: If there are more than 4 trends available, you can select the trend you want to display on the chart by selecting the trend in the dropdown next to the trend label.
The compared Group/Organization will not modify the Capabilities displayed, it will only overlay its Ratings over the displayed Capabilities. If the compared Group/Organization does not have a Rating for a Capability, then the displayed Trend line will move towards the center.
Only the Capability/Trend Ratings are compared. The Entity/Group Rating and Goals/Impediments are not displayed for the compared Group/Organization.
6. CAPABILITY PERFORMANCE
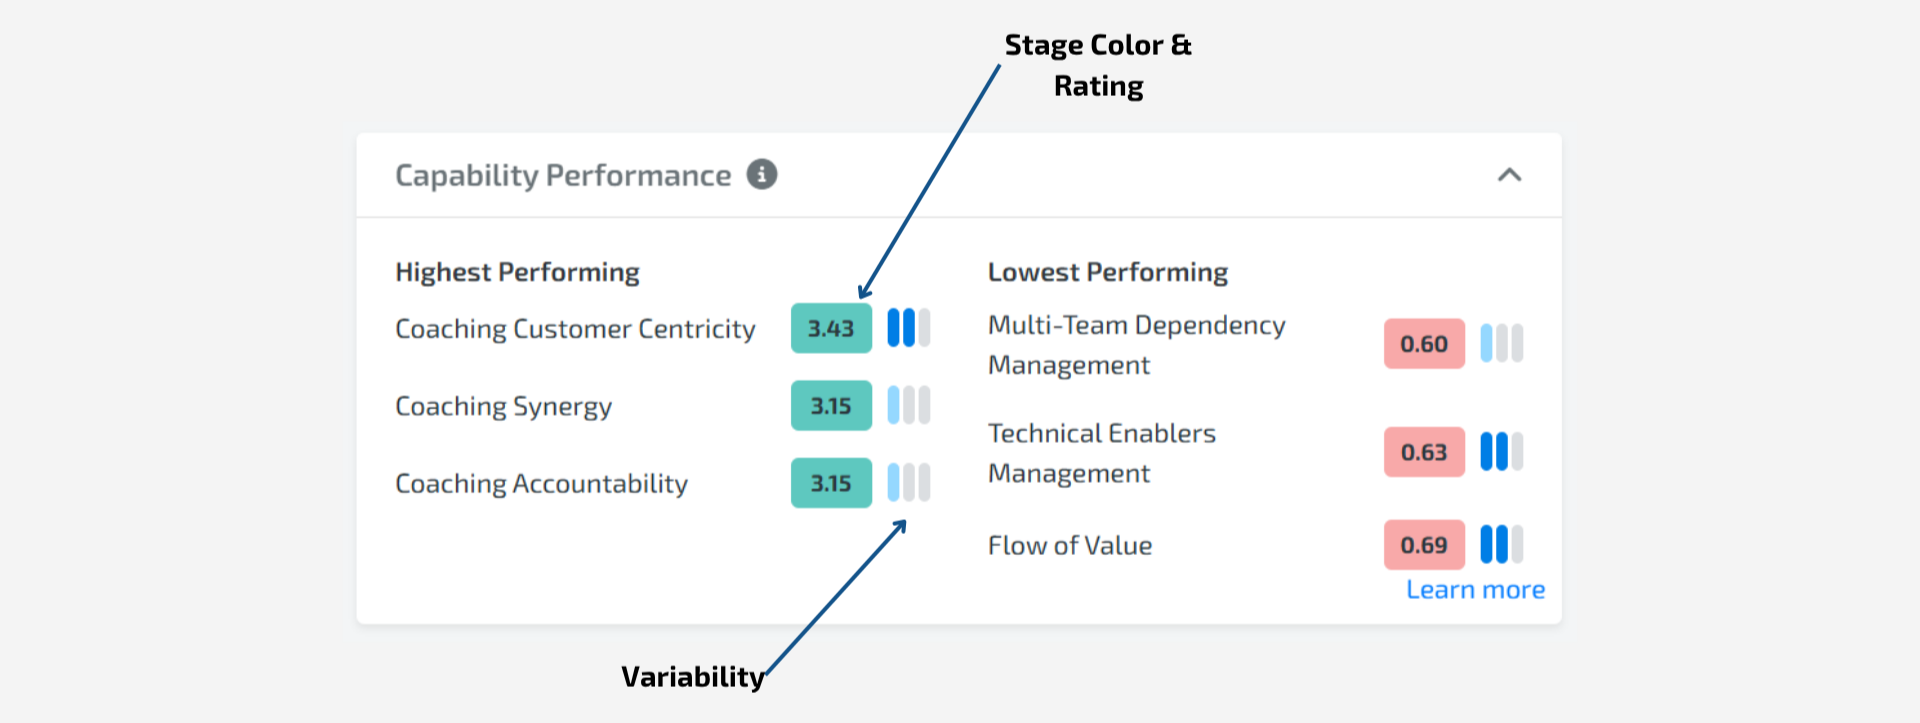
What is the Capability performance widget?
The Capability Performance widget displays the assessed Capabilities with the highest aggregate average Rating and lowest aggregate average Rating in two separate ordered lists.
components
Stage Rating: The aggregate average Rating for a Capability
Hover over the the circle to see the Stage name and the Rating truncated to 2 decimals.
Highest/Lowest Performing
Highest Performing: The Capabilities with the highest Rating. Ordered from highest to lowest.
Lowest Performing: The Capabilities with the lowest Rating. Ordered from lowest to highest.
All assessed Capabilities are considered
In the event of a tie, variability (lowest to highest) is used. If still tied, alphabetical order is used
A maximum of 4 Capabilities will be displayed in each list
Variability: The standard deviation of all received votes mapped to a dot visual.
Zero dots: Standard deviation = 0, all votes are the same (No variability)
One dot: Standard deviation greater than 0 and less than 0.66 (Low variability, high consensus)
Two dots: Standard deviation from 0.67 and up to but not including 1.33 (Medium variability, moderate consensus)
Three dots: Standard deviation of 1.34 or higher (High variability, low consensus)
Note: variability will not appear if all capabilities displayed have have no variability (only 1 vote).
7. CAPABILITY VOTE VARIABILITY
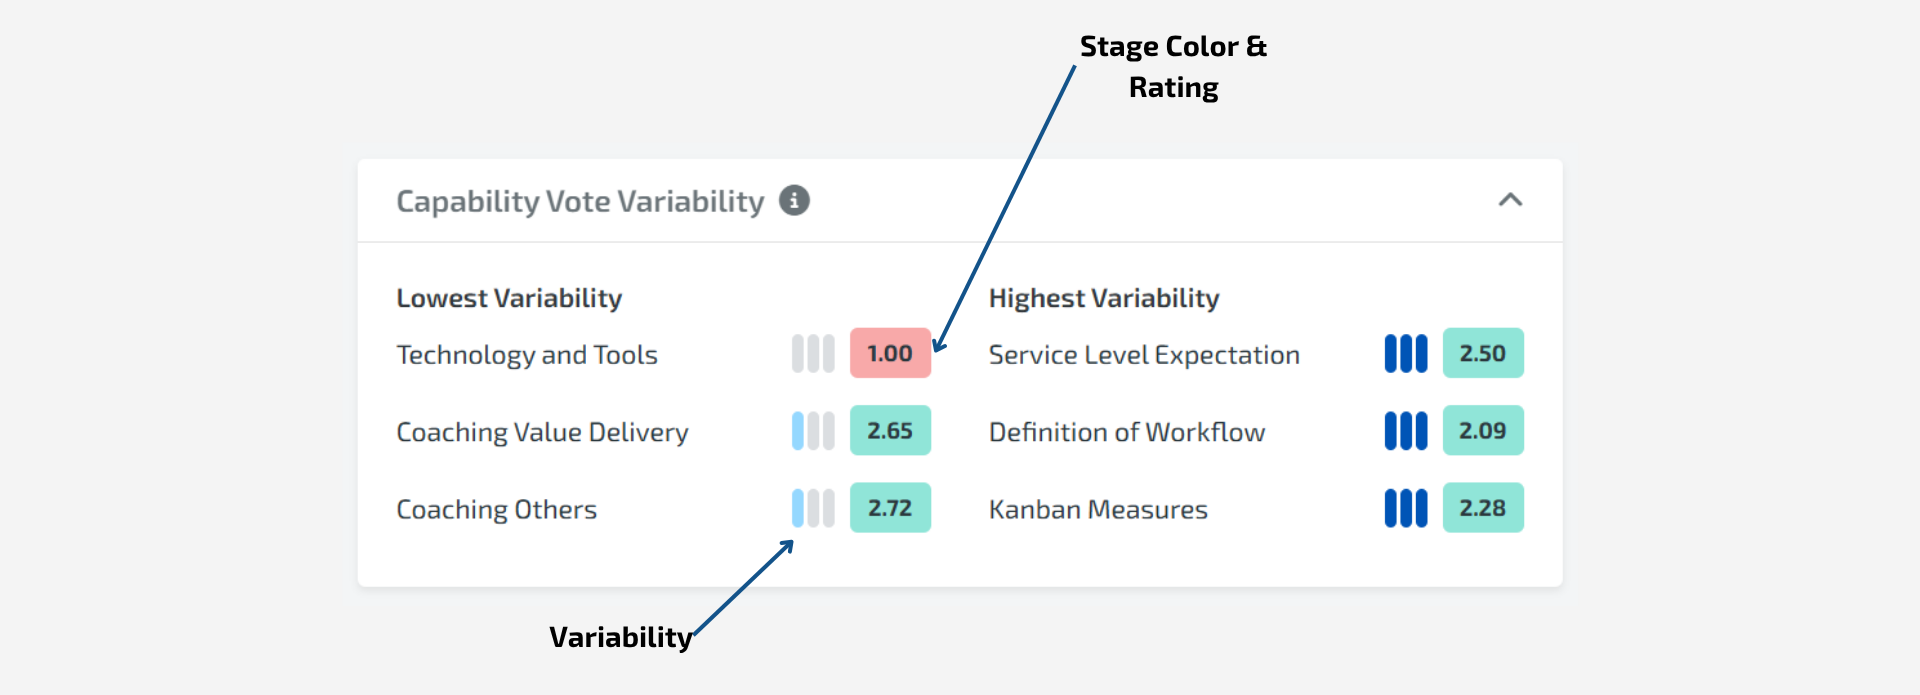
What is the Capability vote variability widget?
The Capability Vote Variability widget displays the Capabilities with the highest and lowest amount of consensus there is among all received votes in two separate ordered lists. Variability is calculated using Standard Deviation - the lower the Standard Deviation, the more consensus there is.
components
Variability: The standard deviation of all received votes mapped to a dot visual.
Zero dots: Standard deviation = 0, all votes are the same (No variability)
One dot: Standard deviation greater than 0 and less than 0.66 (Low variability, high consensus)
Two dots: Standard deviation from 0.67 and up to but not including 1.33 (Medium variability, moderate consensus)
Three dots: Standard deviation of 1.34 or higher (High variability, low consensus)
Lowest/Highest Variability
Lowest Variability: The Capabilities with the lowest Variability. Ordered from lowest to highest Variability.
Highest Variability: The Capabilities with the highest Variability. Ordered from highest to lowest Variability.
All assessed Capabilities are considered
Unless the Capability has only one vote, then it is excluded
In the event of a tie, the Rating (lowest to highest) is used. If still tied, alphabetical order is used
A maximum of 4 Capabilities will be displayed in each list
This widget will show ‘No Data’ if only one member participated in assessments
Stage Rating: The aggregate average Rating for a Capability
Hover over the the circle to see the Stage name and the Rating truncated to 2 decimals.
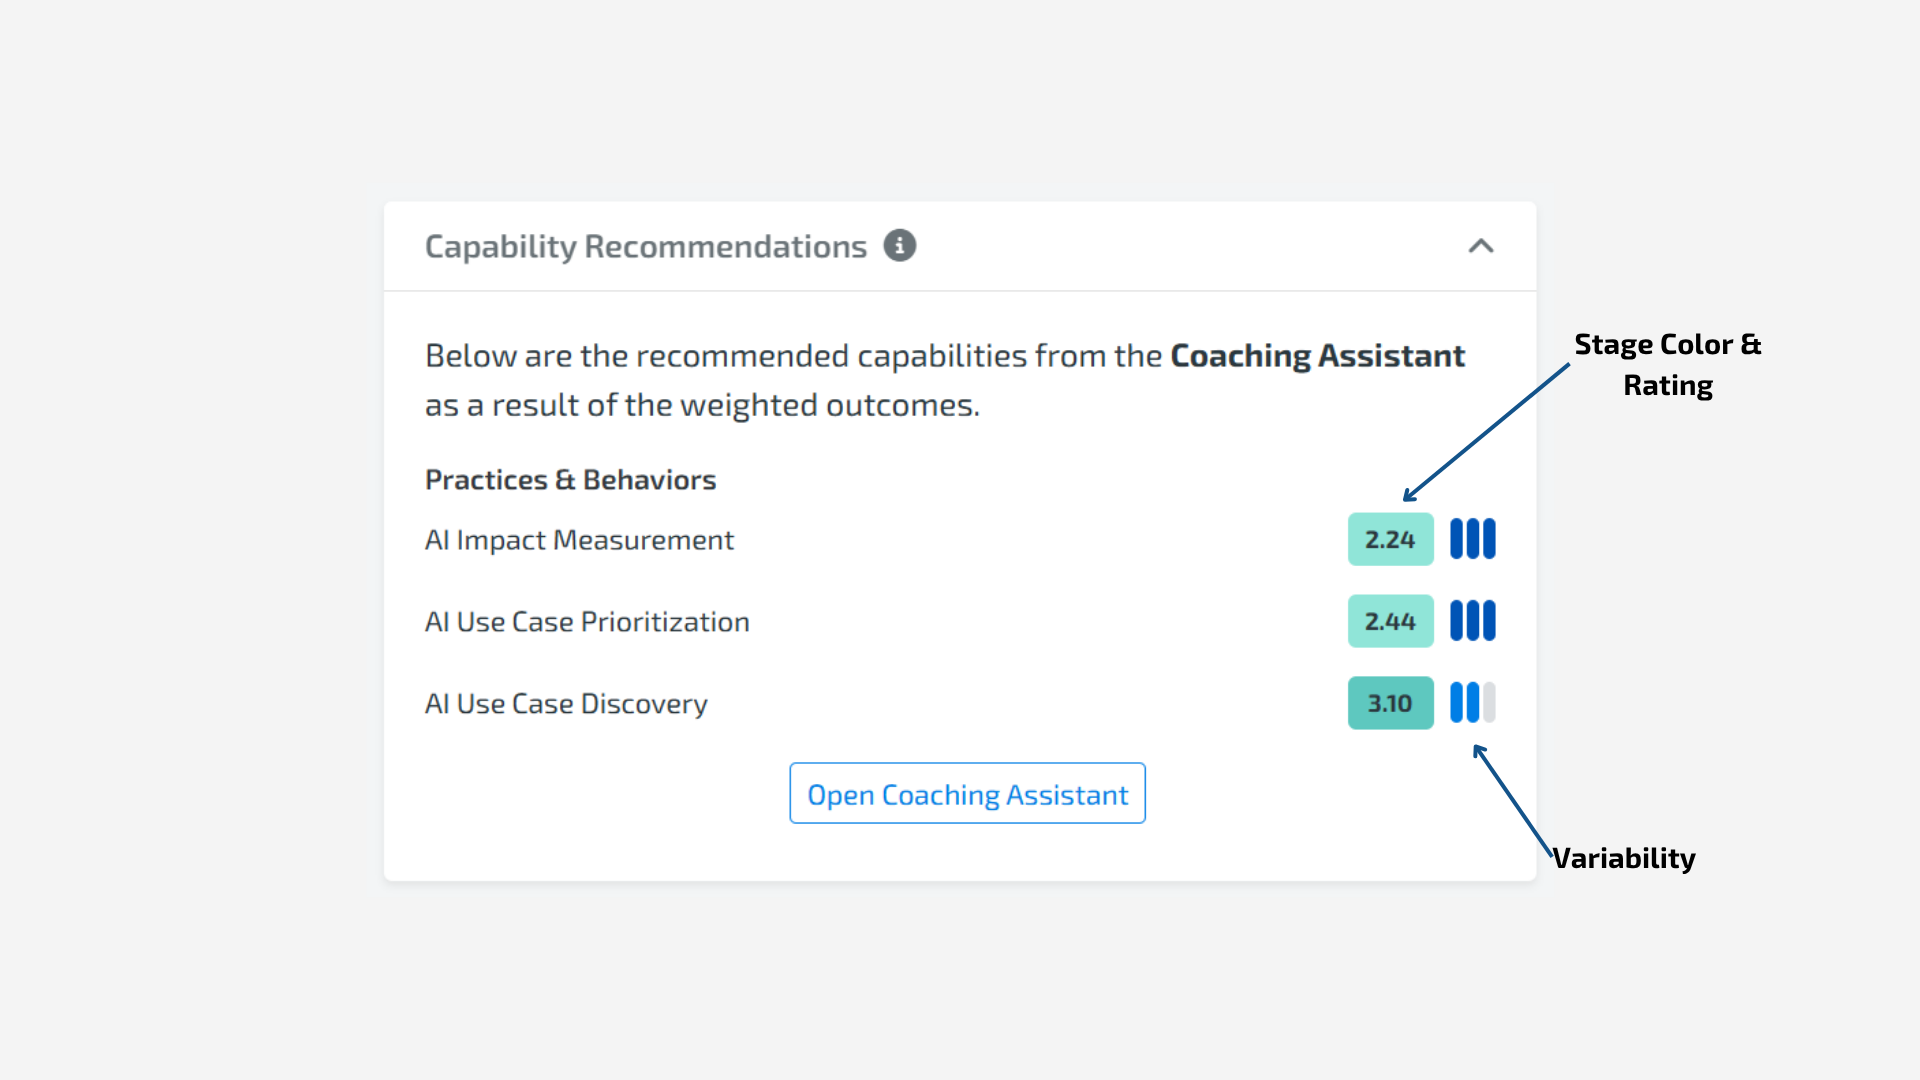
8. CAPABILITY RECOMMENDATIONS
What is the Capability recommendations widget?
The Capability Recommendations widget displays the recommended capabilities to focus on improving. The order is determined by the Coaching Assistant outcome weightings, the Rating, and variability in votes. The Capability Recommendations widget is unique in that it is the only widget that uses the inputs from the Coaching Assistant.
Note: After each assessment, the Capability Recommendations widget outcome weightings will be reset, prompting the member to start the Coaching Assistant again, so that the Capability Recommendations are accurate as priorities change.
components
Start/Open Coaching Assistant button: Launches the Coaching Assistant.
Note: Only Admins, Super Users, and Facilitators can see this button.
Coaching Assistant: A flow that prompts for weighted percentages that the Entity is focusing on.
Step 1: Select the outcomes that are more important to you to achieve
Only the Outcomes that the Entity has answered capabilities for will appear
Select 1 or more outcomes
Step 2: Prioritize and weight the outcomes that are most important for you to achieve
Only the Outcomes that were selected in Step 1 will appear
Allocate a percentage to each Outcome, giving each of them weight against each other. All 100% must be allocated.
Recommendations
Split into two lists. Any list without any Capabilities in it will not be shown
Performance Metrics - Capabilities in a Dimension that has a Measurement Type of Quantitative
Practices & Behaviors - Capabilities in a Dimension that has a Measurement Type of Qualitative
Stage: The aggregate average Rating for a Capability
Hover over the the circle to see the Stage name and the Rating truncated to 2 decimals.
Variability: The standard deviation of all received votes mapped to a dot visual.
Zero dots: Standard deviation = 0, all votes are the same (No variability)
One dot: Standard deviation greater than 0 and less than 0.66 (Low variability, high consensus)
Two dots: Standard deviation from 0.67 and up to but not including 1.33 (Medium variability, moderate consensus)
Three dots: Standard deviation of 1.34 or higher (High variability, low consensus)
How the order is determined
Outcome weighting, highest to lowest - the sum of the Coaching Assistant Outcome weightings that are associated with each capability.
Each capability maps to one or more outcomes. For each of those outcomes that were assigned a percentage in the Coaching Assistant, the percentage gets added to the capability’s outcome weighting.
For example, if the Coaching Assistant has Time to Market 30%, Innovation 20%, and Reliability 50%, then if Capability 1 is associated with Time to Market and Reliability, it will be given a score of 80%.Outcome weightings don’t have to be set manually every time. Organization Admins can pre-configure default weightings, allowing teams to start with a consistent, strategic baseline instead of reinventing the wheel each time.
For more information, check out this documentation.
Rating, lowest to highest (tiebreaker 1)
Variability, lowest to highest (tiebreaker 2)
Note: only the top 4 capabilities are listed. If any capabilities are tied with the 4th place capability on all tiebreakers, then those capabilities will be listed also.
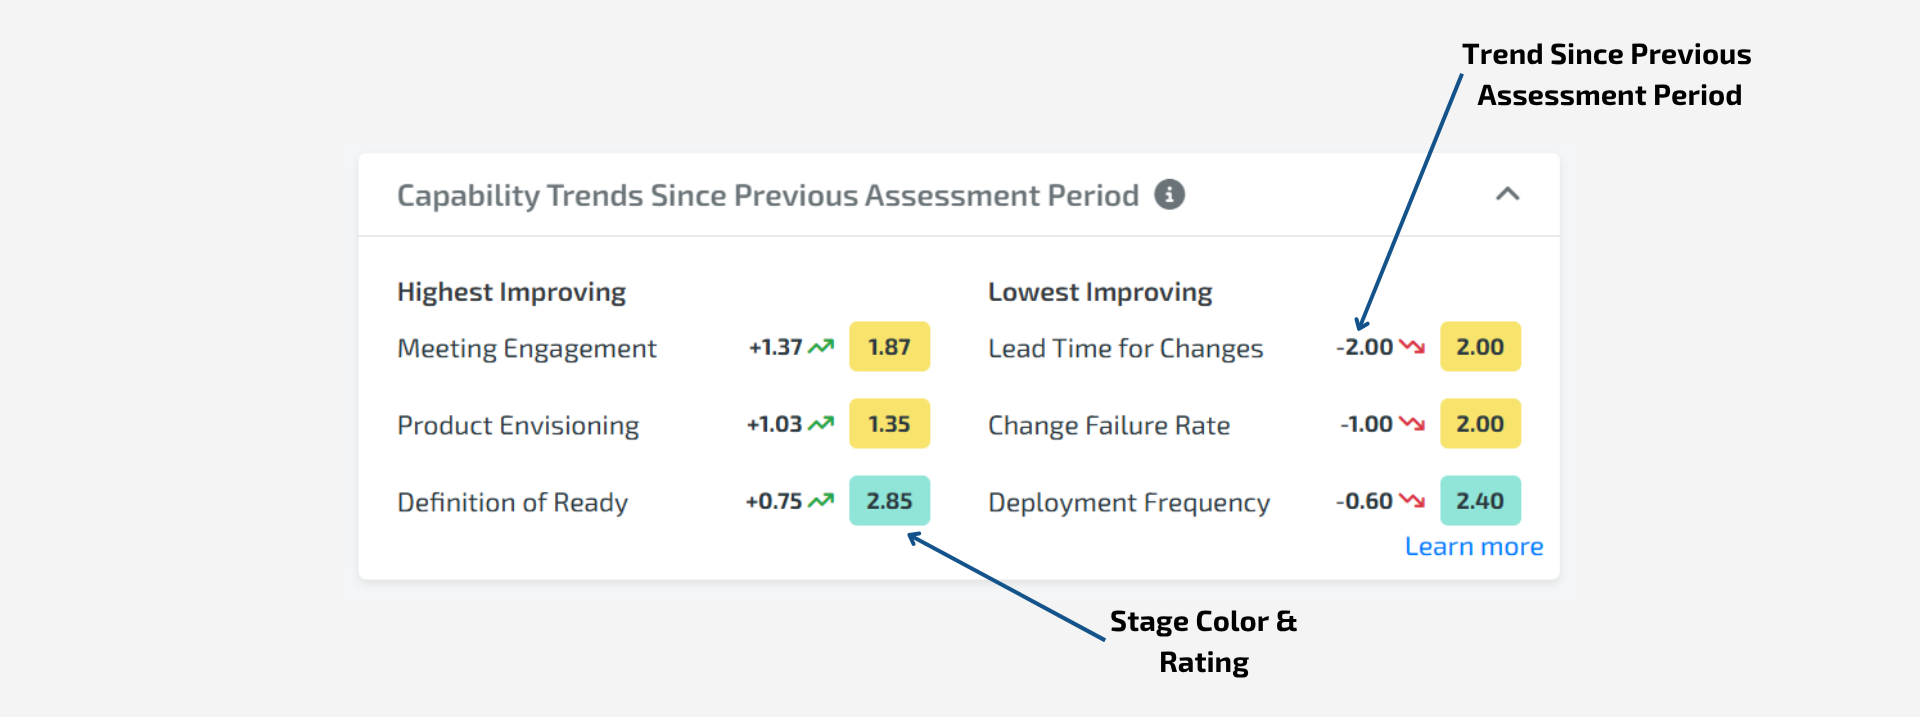
9. CAPABILITY TRENDS SINCE PREVIOUS ASSESSMENT PERIOD
What is the Capability trends since PREVIOUS assessment period widget?
The Capability Trends Since Previous Assessment Period widget displays the Capabilities with the highest and lowest Rating change - comparing the latest Ratings to the previous Ratings of all time for each Capability. Two separate ordered lists are used.
components
Capability Name: Click this to open the Capability Drilldown.
Rating: The aggregate average Capability Rating, truncated to 2 decimals.
Stage color: Uses the legend at the top of the dashboard to translate the Rating to a Stage
Rating Trend: A comparison between the previous Trend and the current Trend. When hovering, this displays the previous Trend’s Stage and Rating.
Up Arrow - If the Rating is greater than the previous Trend’s Rating
Right Arrow - If the Rating is equal to the previous Trend’s Rating
Down Arrow - If the Rating is less than the previous Trend’s Rating
No Arrow - If no previous Trend exists
Highest/Lowest Improving
Highest Improving: The Capabilities with the highest improvement. Ordered from highest raw point increase to lowest raw point decrease.
Lowest Improving: The Capabilities with the lowest improvement. Ordered from lowest raw point increase to highest raw point decrease.
All assessed Capabilities are considered
In the event of a tie, Variability (lowest to highest) is used. If still tied, Rating (highest to lowest) is used. If still tied, alphabetical order is used
A maximum of 3 Capabilities will be displayed in each list
This widget will show ‘No Data’ if only only one Trend exists
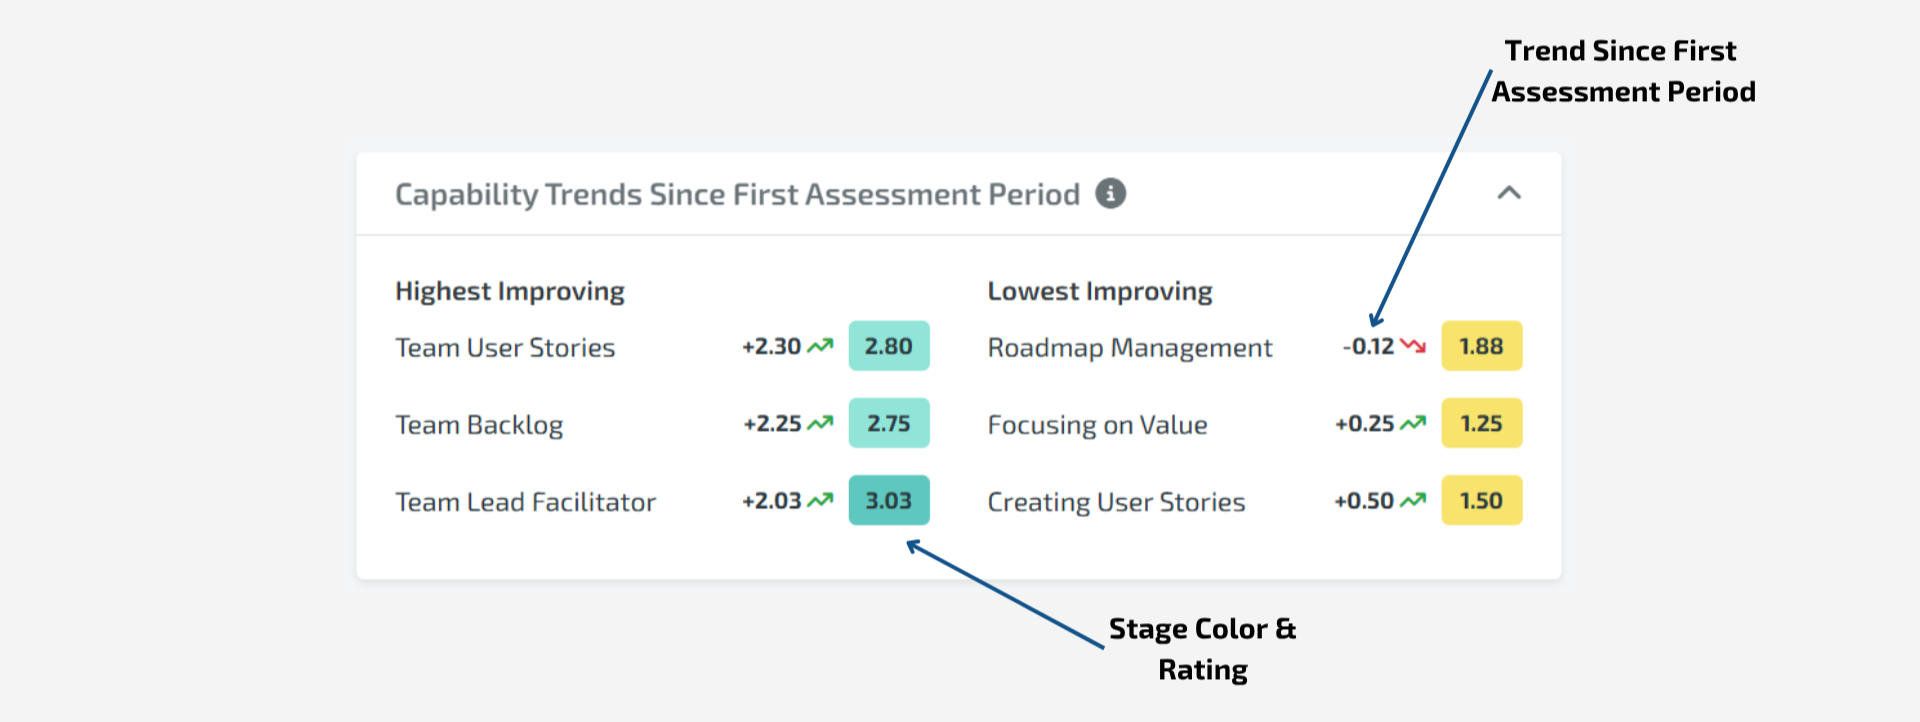
10. CAPABILITY TRENDS SINCE FIRST ASSESSMENT PERIOD
What is the Capability trends since first assessment period widget?
The Capability Trends Since First Assessment Period widget displays the Capabilities with the highest and lowest Rating change - comparing the latest Ratings to the first Ratings of all time for each Capability. Two separate ordered lists are used.
components
Capability Name: Click this to open the Capability Drilldown.
Rating: The aggregate average Capability Rating, truncated to 2 decimals.
Stage color: Uses the legend at the top of the dashboard to translate the Rating to a Stage
Rating Percentage Trend: A comparison between the first Trend and the current Trend. When hovering, this displays the First Trend’s Stage and Rating.
Up Arrow - If the Rating is greater than the first Trend’s Rating
Right Arrow - If the Rating is equal to the first Trend’s Rating
Down Arrow - If the Rating is less than the first Trend’s Rating
No Arrow - If no first Trend exists
Highest/Lowest Improving
Highest Improving: The Capabilities with the highest improvement. Ordered from highest raw point increase to lowest raw point decrease.
Highest Variability: The Capabilities with the lowest improvement. Ordered from lowest raw point increase to highest raw point decrease.
All assessed Capabilities are considered
In the event of a tie, Variability (lowest to highest) is used. If still tied, Rating (highest to lowest) is used. If still tied, alphabetical order is used
A maximum of 3 Capabilities will be displayed in each list
This widget will show ‘No Data’ if only only one Trend exists
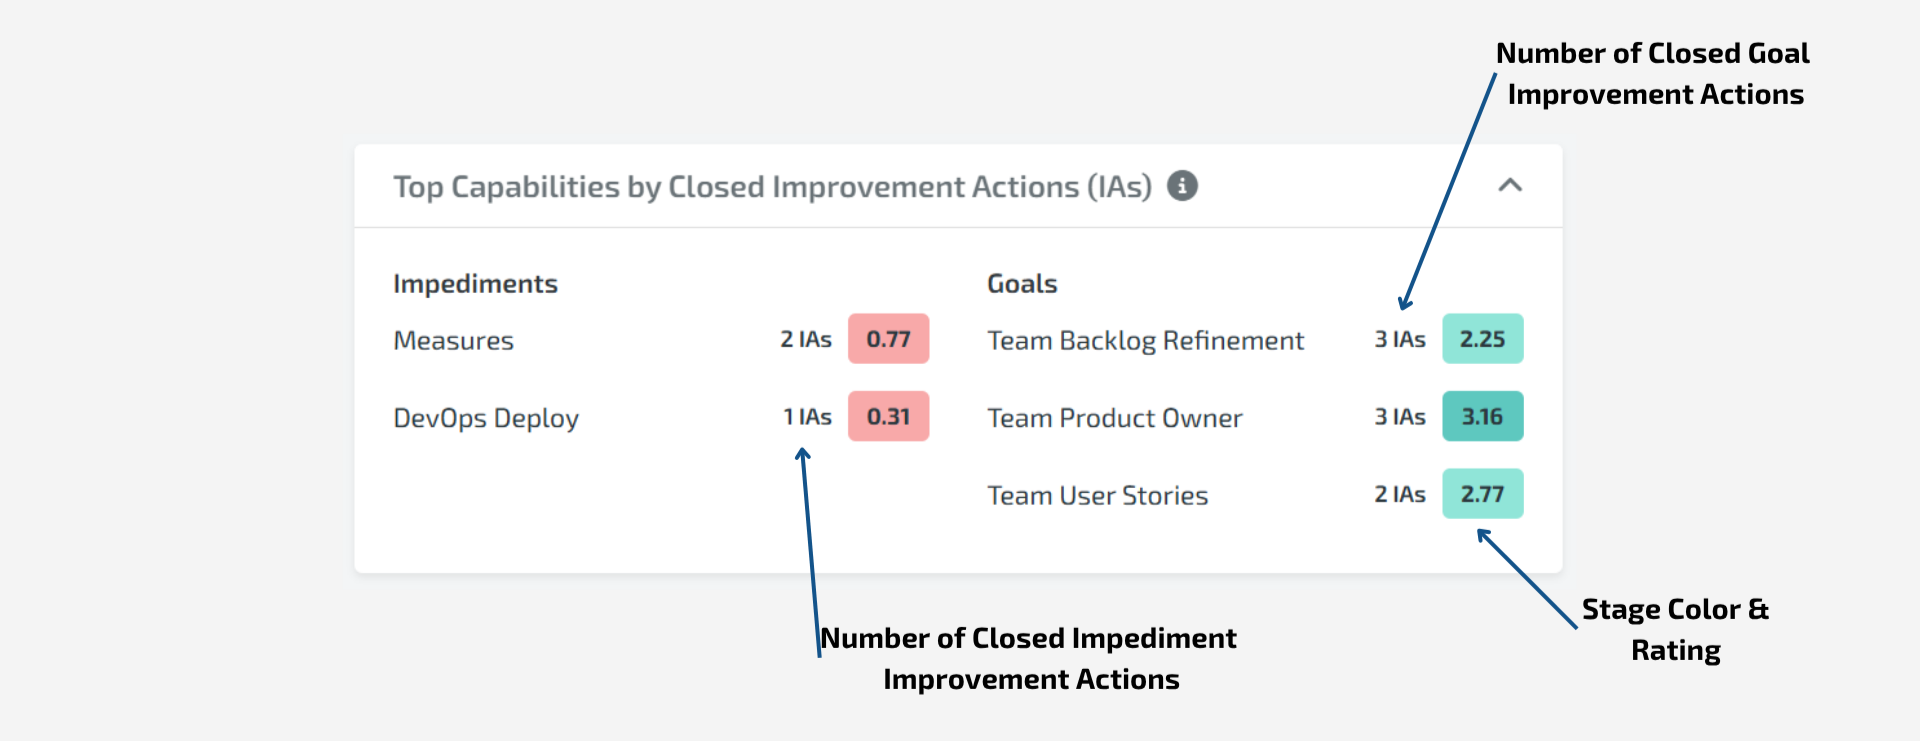
11. TOP CAPABILITIES BY CLOSED IMPROVEMENT ACTIONS (IAS)
What is the Top Capabilities by Closed Improvement Actions (ias)?
The Top Capabilities By Closed Improvement Actions (IAs) widget displays the Capabilities with the most closed improvement actions. Two separate ordered lists are used.
components
Capability Name: Click this to open the Capability Drilldown.
Rating: The aggregate average Capability Rating, truncated to 2 decimals.
Stage color: Uses the legend at the top of the dashboard to translate the Rating to a Stage
Impediment List: Capabilities with closed improvement actions that are Impediment.
Number of Closed Impediment Improvement Actions: This shows the number of closed Improvement Actions that are Impediment.
Goal List: Capabilities with closed improvement actions that are Goal.
Number of Closed Goal Improvement Actions: This shows the number of closed Improvement Actions that are Goal.
Impediment/Goal List
In the event of a tie, Rating (highest to lowest) is used. If still tied, alphabetical order is used
A maximum of 3 Capabilities will be displayed in each list
A list will not display if there are no capabilities with closed IAs.
This widget will show ‘No Data’ if both Impediment and Goal lists are empty.
12. TOP CAPABILITIES MARKED FOR IMPROVEMENT
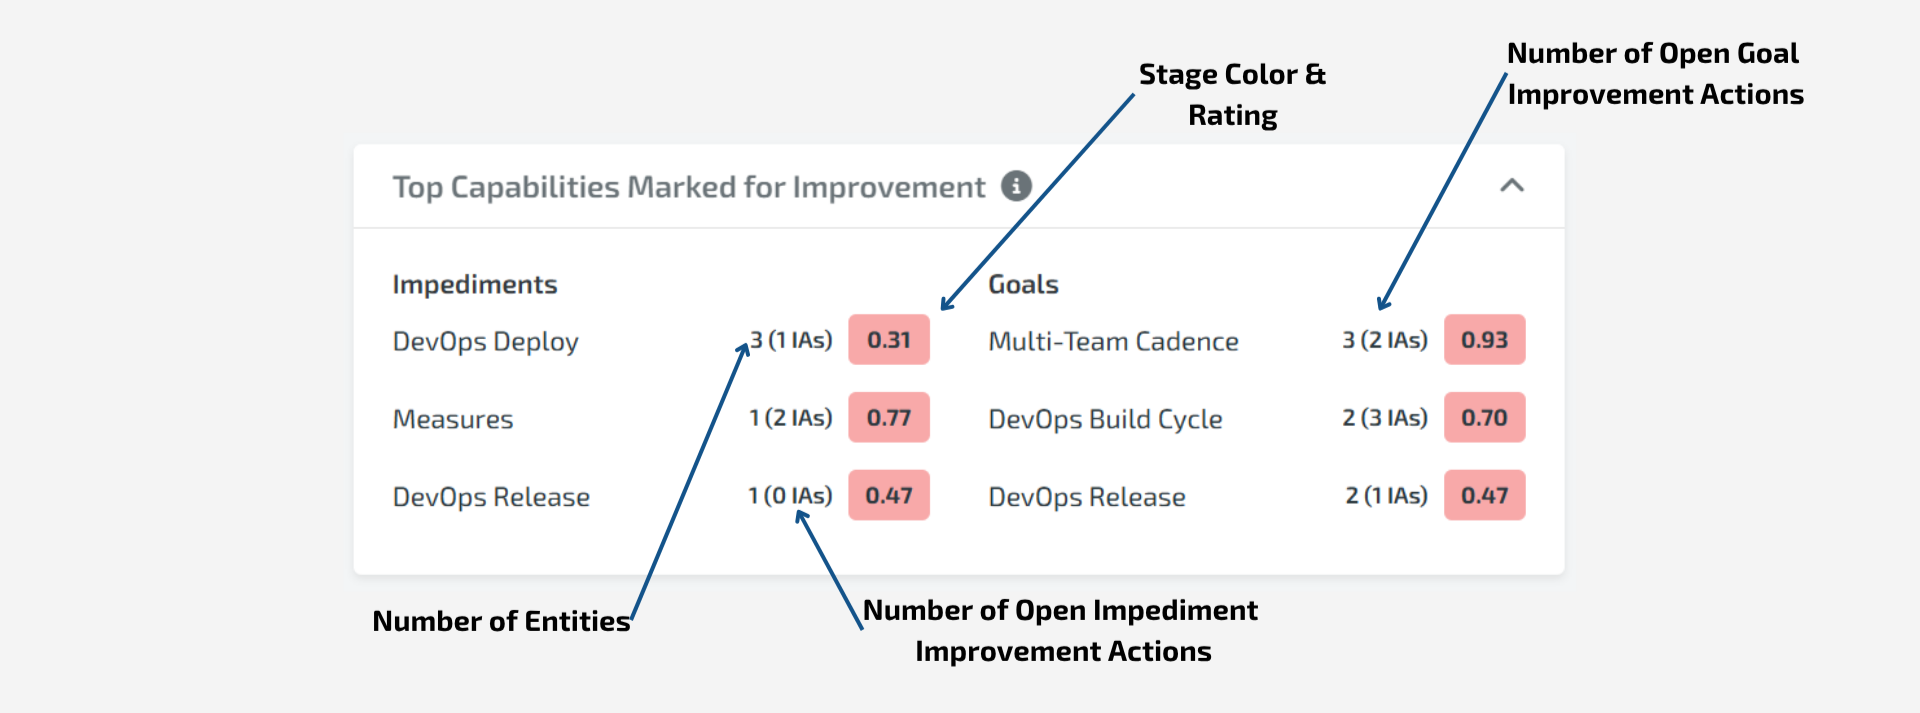
What is the Top Capabilities Marked for Improvement?
The Top Capabilities Marked for Improvement widget displays the Capabilities with the most marked as Impediment or Goal. Two separate ordered lists are used.
components
Capability Name: Click this to open the Capability Drilldown.
Rating: The aggregate average Capability Rating, truncated to 2 decimals.
Stage color: Uses the legend at the top of the dashboard to translate the Rating to a Stage
Number of Entities: Only at Group level, this shows the number of entities that have currently marked the capability as an Impediment or Goal (depending on which list).
Impediment List: Capabilities that are marked as Impediment, ordered from highest Impediment count to lowest.
Number of Open Impediment Improvement Actions: This shows the number of Open Improvement Actions that are Impediment.
Goal List: Capabilities that are marked as Goal, ordered from highest Goal count to lowest.
Number of Open Goal Improvement Actions: This shows the number of Open Improvement Actions that are Goal.
Impediment/Goal List
In the event of a tie, number of open IAs (highest to lowest) is used. If still tied, Rating (highest to lowest) is used. If still tied, alphabetical order is used
A maximum of 3 Capabilities will be displayed in each list
A list will not display if there are no capabilities currently marked as an Impediment or Goal.
This widget will show ‘No Data’ if both Impediment and Goal lists are empty.
13. METRICS
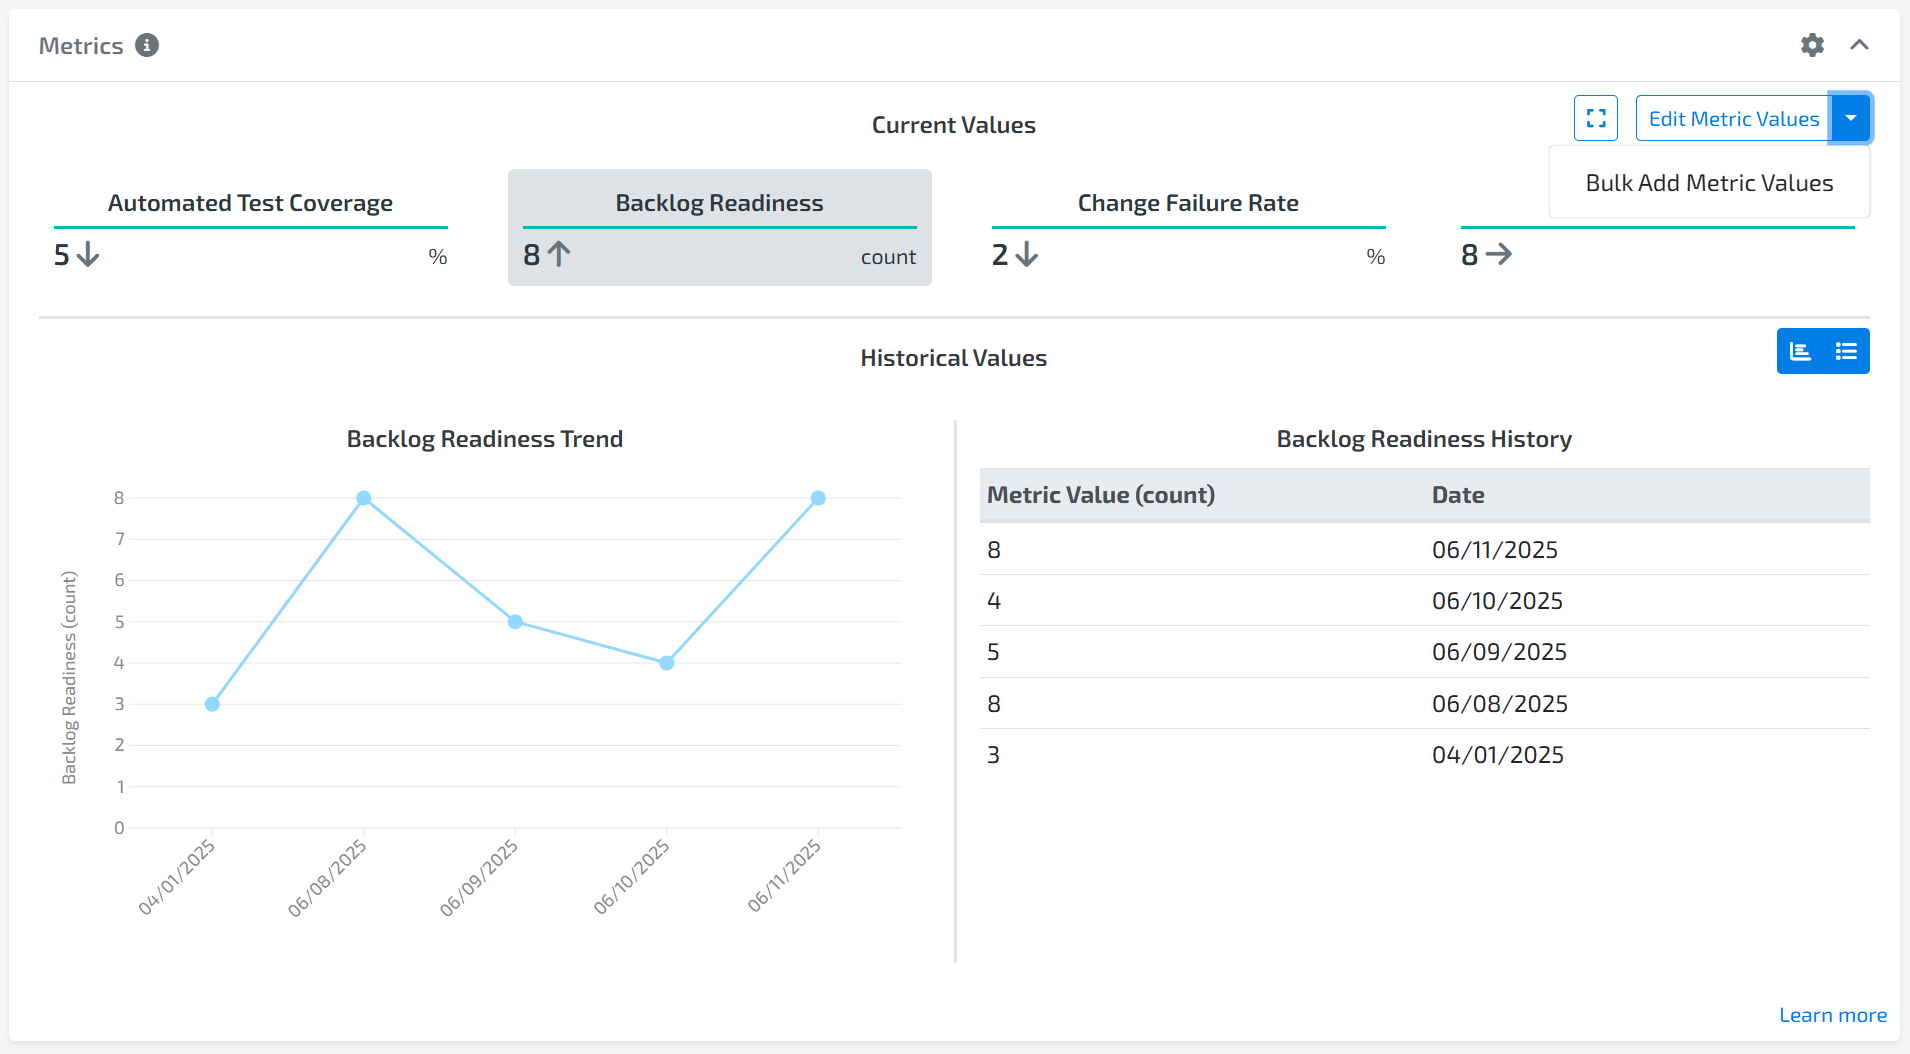
What is the metrics widget?
The Metrics is a free-form data entry tool to help visualize other metrics besides the ones inside LAI. No assessment calculations or logic is used in this widget.
Metrics are defined by an Admin in the Custom Metrics screen. The Values can be added/edited/deleted by Admins, Super Users, and Facilitators in the Results Insights Canvas.
The Values entered are associated with the selected Organization/Group/Entity. No aggregation is done at the Group or Organization level.
components
Metric Name: The custom name of the metric, as input by an Admin in the Custom Metrics screen
Metric Unit: The unit of the metric, as input by an Admin in the Custom Metrics screen
Metric Value: The custom value of the metric, as input by the member
Metric Trend: The interpreted trend using the 2 most recent chronological values
Up: The most recent value is greater than the second most recent value
Right: The most recent value is equal to the second most recent value
Down: The most recent value is less than the second most recent value
None: Less than 2 values exist
Toggle single Historical Value: Click any metric to show/hide the Trend graph and history for that metric
Toggle all Historical Values: Click to show all Trend graph and history tables for that metric
Toggle all Trend Charts: Click to show/hide all Trend charts
Toggle all History Tables: Click to show/hide all History tables
Trend Chart: A line graph of the 8 most recent values. Hover to see exact value.
History table: A table of the 8 most recent values in descending chronological order.
Edit Metric Values: Launches a popup to input the metrics
Custom Metrics are per Entity/Group/Organization. The Metrics will only appear on the dashboard of the Entity/Group/Organization that is selected in the Organization Tree.
Only Admins, Super Users, and Facilitators have permission to see this button and edit. Team Members do not have permission to edit, but they do have permission to view.
Bulk Add Metric Values: Launches a popup for importing metric values in bulk
At the Organization/Group level, metric values can be added for multiple entities/groups at once.
At the Entity level, multiple metric values can be added for that specific entity.
Enter each metric on a new line, separating each field with a comma or tab as shown in the example provided in the popup.
14. GROUP HEATMAP
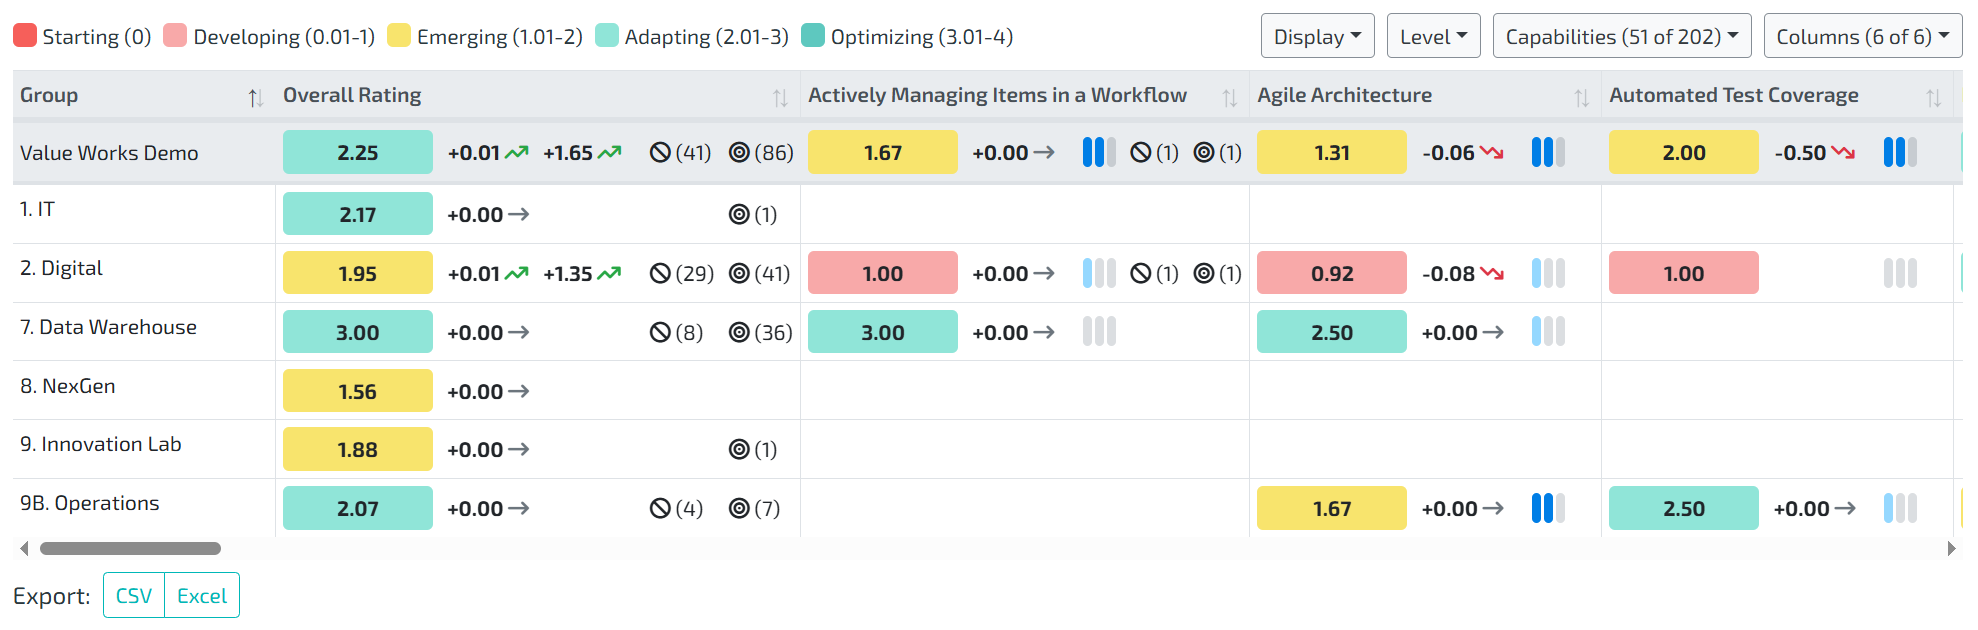
What is the group heatmap widget?
The Group Heatmap widget is designed to view many Entities/Groups at once and visually find patterns in all types of different metrics. It is a super-flexible widget that allows aggregation via Capability, Dimension, or Outcome. As well as the ability to hide/view and sort columns. A summary row for the currently-viewed Entity/Group/Organization is shown at the bottom of the widget.
components
Capabilities/Dimensions/Outcomes selector: Select one of these to determine the columns of the table below. Data is aggregated based on this selection.
Filter Data: Ways to hide/show rows/columns
Display: Toggles the rows of the table between Entities and Groups.
If Entities is chosen, all Entities within the currently-viewed Group/Organization will be displayed
If Groups is chosen, all subgroups of the currently-viewed Group/Organization will be shown
This selector will not be shown if no subgroups exist
Displayed Capabilities/Dimensions/Outcomes: The columns of the table to be shown. Add/remove columns here to view only the data you want to see.
Displayed Columns: The metrics that you want to view in the table. Add/remove columns here to view only the data you want to see.
Export Data: Export in either CSV or Excel format. Find the buttons on the bottom right of the grid.
Provides an export of all visible data in the grid
Group Heatmap table columns:
Entity/Group: The name of the Entities (if Entities are displayed) or the name of the Groups (if Groups are displayed). Click on the name to navigate to the dashboard of the chosen Entity.
Entity/Group Rating: A special column that is the Entity/Group Rating/Trend/Variability/Impediment Count/Goal Count of the Entity/Group in each row.
Metric data
Rating: The aggregate average Capability Rating. Uses the legend at the top of the dashboard to translate the Rating to a Stage. Hover to see the Rating truncated to 2 decimals.
Trend (Previous): A comparison between the previous Trend and the current Trend. When hovering, this displays the Previous Trend’s Stage and Rating.
Up Arrow - If the Rating is greater than the previous Trend’s Rating
Right Arrow - If the Rating is equal to the previous Trend’s Rating
Down Arrow - If the Rating is less than the previous Trend’s Rating
No Arrow - If no previous Trend exists
Trend (First): A comparison between the previous Trend and the current Trend. When hovering, this displays the First Trend’s Stage and Rating.
Up Arrow - If the Rating is greater than the first Trend’s Rating
Right Arrow - If the Rating is equal to the first Trend’s Rating
Down Arrow - If the Rating is less than the first Trend’s Rating
No Arrow - If no first Trend exists
Variability: The standard deviation of all received votes mapped to a dot visual.
Zero dots: Standard deviation = 0, all votes are the same (No variability)
One dot: Standard deviation greater than 0 and less than 0.66 (Low variability, high consensus)
Two dots: Standard deviation from 0.67 and up to but not including 1.33 (Medium variability, moderate consensus)
Three dots: Standard deviation of 1.34 or higher (High variability, low consensus)
Goal Count: The number of Entity-Capability pairs that are currently marked as a Goal
Impediment Count: The number of Entity-Capability pairs that are currently marked as an Impediment
15. CAPABILITY DETAILS
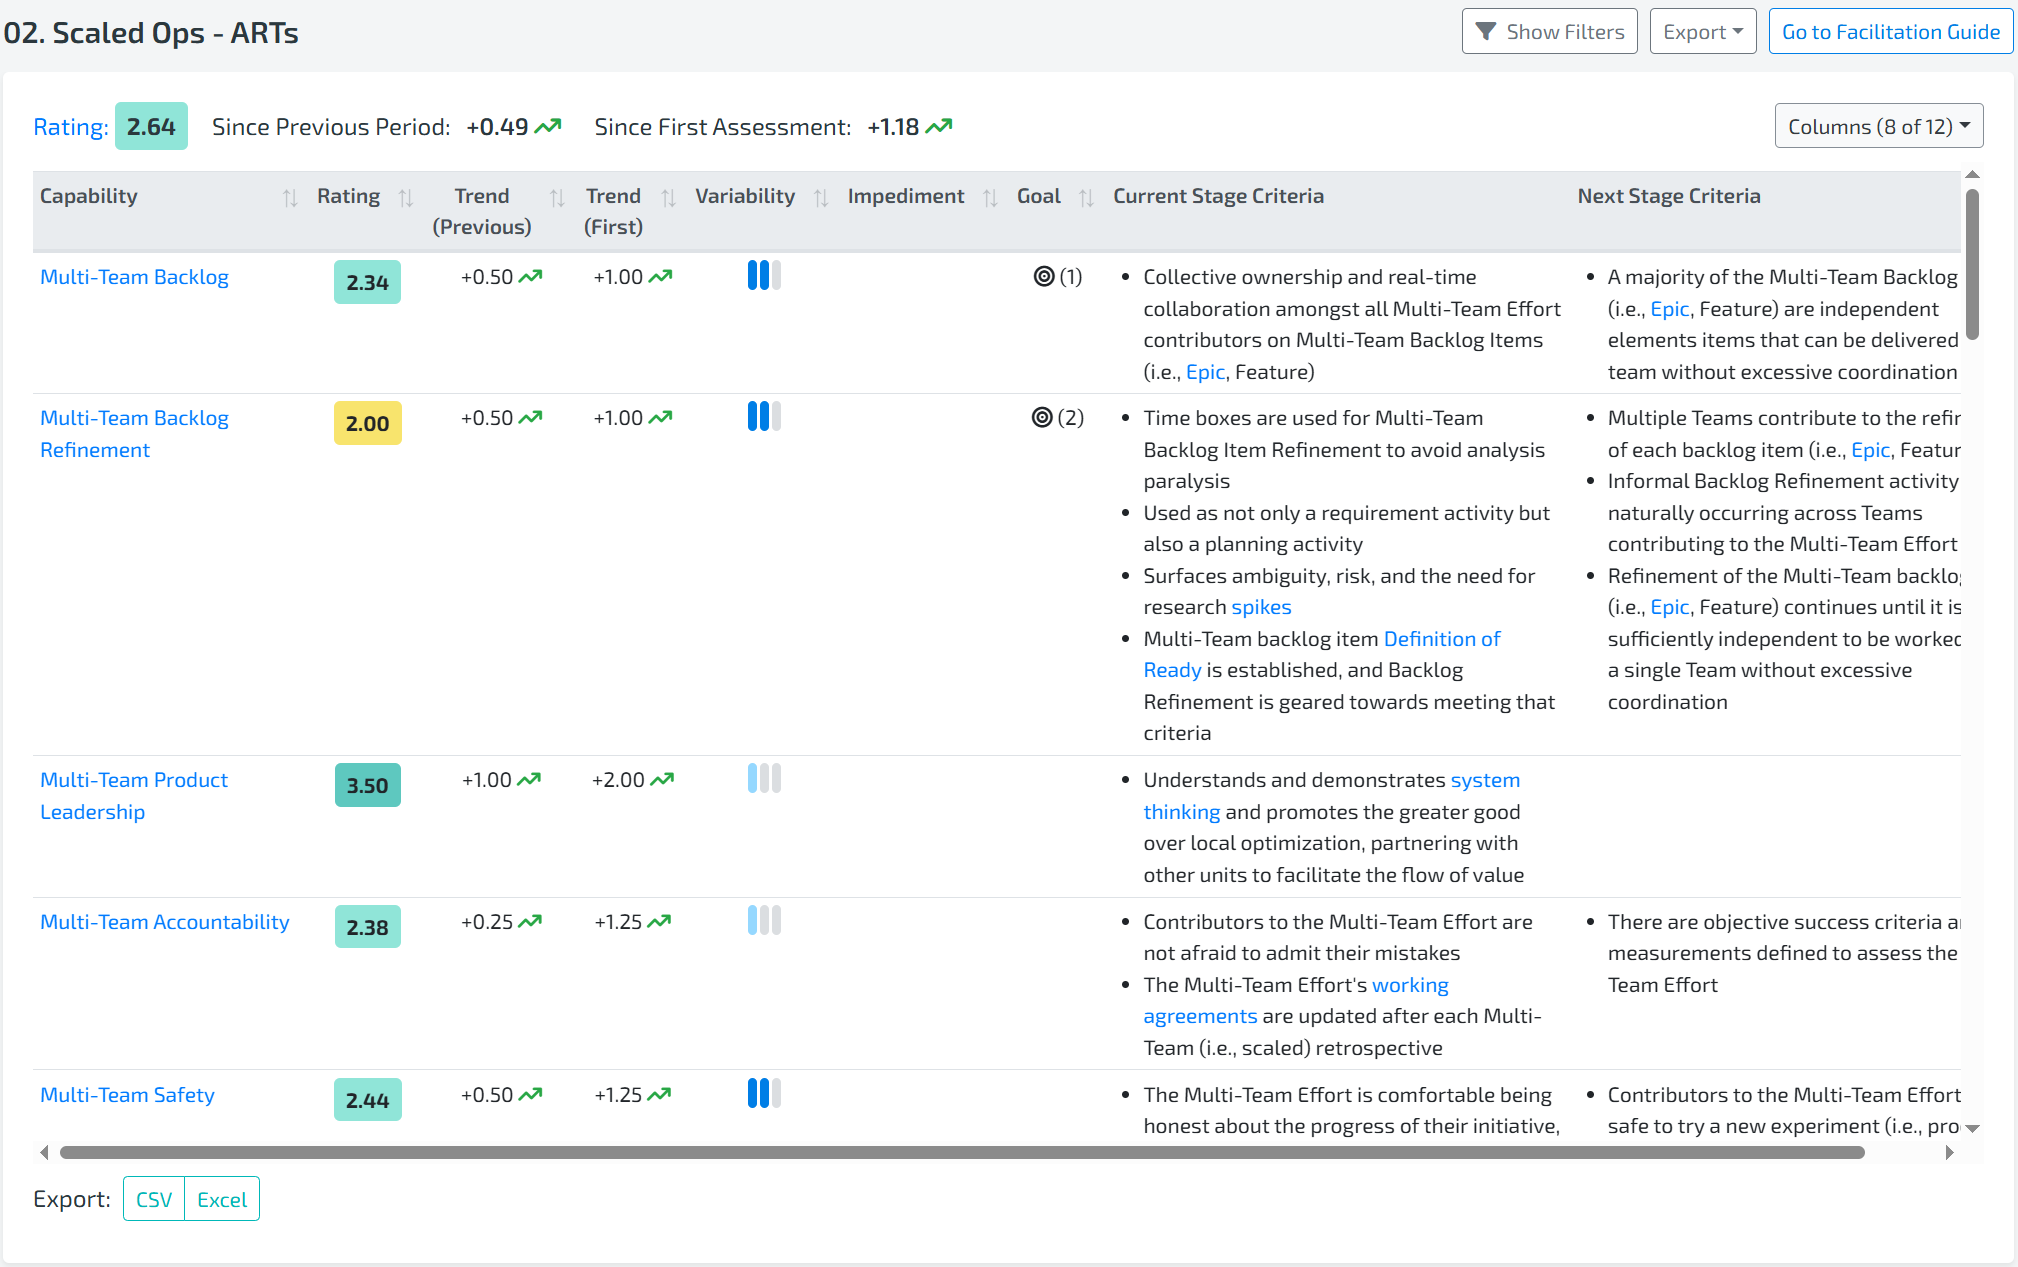
What is the Capability details widget?
The Capability Details widget provides one of the most comprehensive views on details of each assessed Capability. In particular, this widget is useful for comparing Capabilities side by side. By default, the Capabilities are ordered by Dimension and then alphabetical.
Customize Columns: Use the “Show/Hide Data” section to customize the displayed columns.
Show System Notes: When “Last Assessment Notes” column in shown, this will toggle the visibility of system-generated Notes in the “Last Assessment Notes” column
Sort: Note that the majority of the columns are sortable by clicking the column name.
Export Data: Export in either CSV or Excel format. Find the buttons on the top right of the grid.
Provides an export of all visible data in the grid
components
Entity/Group Rating: The aggregate average Capability Rating for all assessed Capabilities, truncated to 2 decimals.
Entity/Group Rating Trend: A comparison between the previous Trend and the current Trend.
Stage: The aggregate average Rating mapped for the given Capabilities mapped to a color using the legend at the top of the dashboard.
Hover over the the circle to see the Stage name and the Rating truncated to 2 decimals.
Impediment: This icon will appear if the Capability is marked as an impediment by at least one Entity. Hover over the icon to view the Entities that have this Capability marked as an Impediment.
Trend (Previous): A comparison between the previous Trend and the current Trend for the Capability.
Hover over the the arrow to see the Stage name and the truncated Rating
Trend (First): A comparison between the first Trend and the current Trend for the Capability.
Hover over the the arrow to see the Stage name and the truncated Rating
Variability: The standard deviation of all received votes for a Capability mapped to a dot visual.
Zero dots: Standard deviation = 0, all votes are the same (No variability)
One dot: Standard deviation greater than 0 and less than 0.66 (Low variability, high consensus)
Two dots: Standard deviation from 0.67 and up to but not including 1.33 (Medium variability, moderate consensus)
Three dots: Standard deviation of 1.34 or higher (High variability, low consensus)
Growth Goal: This icon will appear if the Capability is marked as a Goal by at least one Entity. Hover over the icon to view the Entities that have this Capability marked as a Goal.
Current Stage Criteria: The criteria for the given Capability that corresponds to the current Stage for the Capability.
Next Stage Criteria: The criteria for the given Capability for that corresponds to the next highest Stage for the Capability. For example, if the Stage is Emerging, then the criteria for Adapting will be shown in this column. If the Stage is Optimizing, then this column is blank because there is no higher Stage.
Last Assessment Comments: The assessment comments from the last completed assessment for each Capability. Only displayed by default when viewing Results for an Entity.
Last Assessment Prompts: The assessment prompt responses from the last completed assessment for each Capability. Only displayed by default when viewing Results for an Entity.
AI Comment Summary: An AI summary of the Last Assessment Comments and/or Last Assessment Prompts columns. Click “Generate AI Summary” button to enable. After clicking, the summary will remain until comments are added or removed. At least 2 comments are required to generate a summary.
Improvement Actions: The improvement actions for each Capability for each Entity. Only displayed by default when viewing Results for an Entity.
16. DIMENSION TRENDS
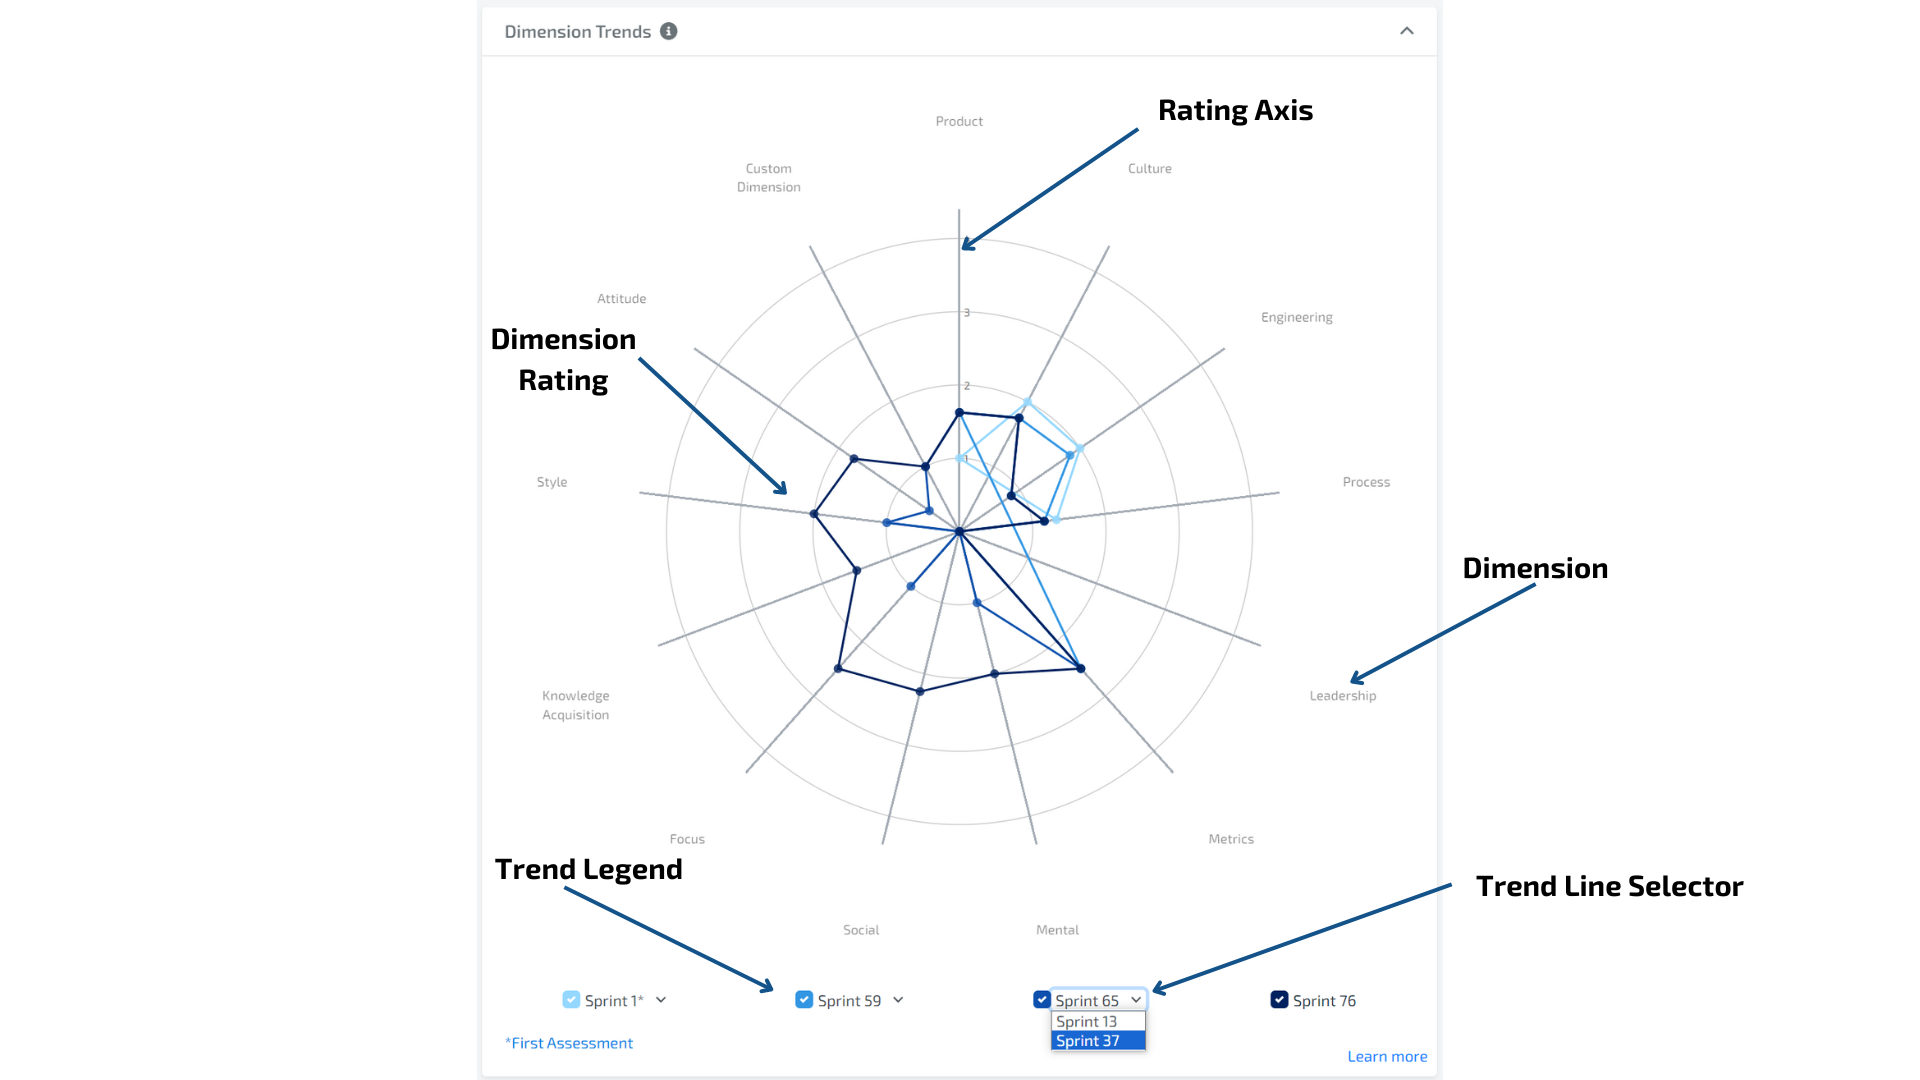
What is the dimension trends widget?
The Dimension Trends widget plots the Dimension Ratings by Trend.
components
Dimension Trend: The aggregate average Capability Rating for all the Capabilities that are in a given Dimension for each Trend.
Hover over a dot to see the Rating truncated to 2 decimals.
The Trends are displayed with the most recent Trends on top. This means the most recent Trends could hide parts or all of previous Trends.
Note: If there are more than 4 trends available, you can select the trend you want to display on the chart by selecting the trend in the dropdown next to the trend label.
17. OUTCOME TRENDS

What is the outcome trends widget?
The Outcome Trends widget plots the Outcome Ratings by Trend.
components
Outcome Trend: The aggregate average Capability Rating for all the Capabilities that are associated with the given Outcome for each Trend.
Hover over a dot to see the Rating truncated to 2 decimals.
The Trends are displayed with the most recent Trends on top. This means the most recent Trends could hide parts or all of previous Trends.
Note: If there are more than 4 trends available, you can select the trend you want to display on the chart by selecting the trend in the dropdown next to the trend label.
18. IMPROVEMENT ACTIONS DETAILS
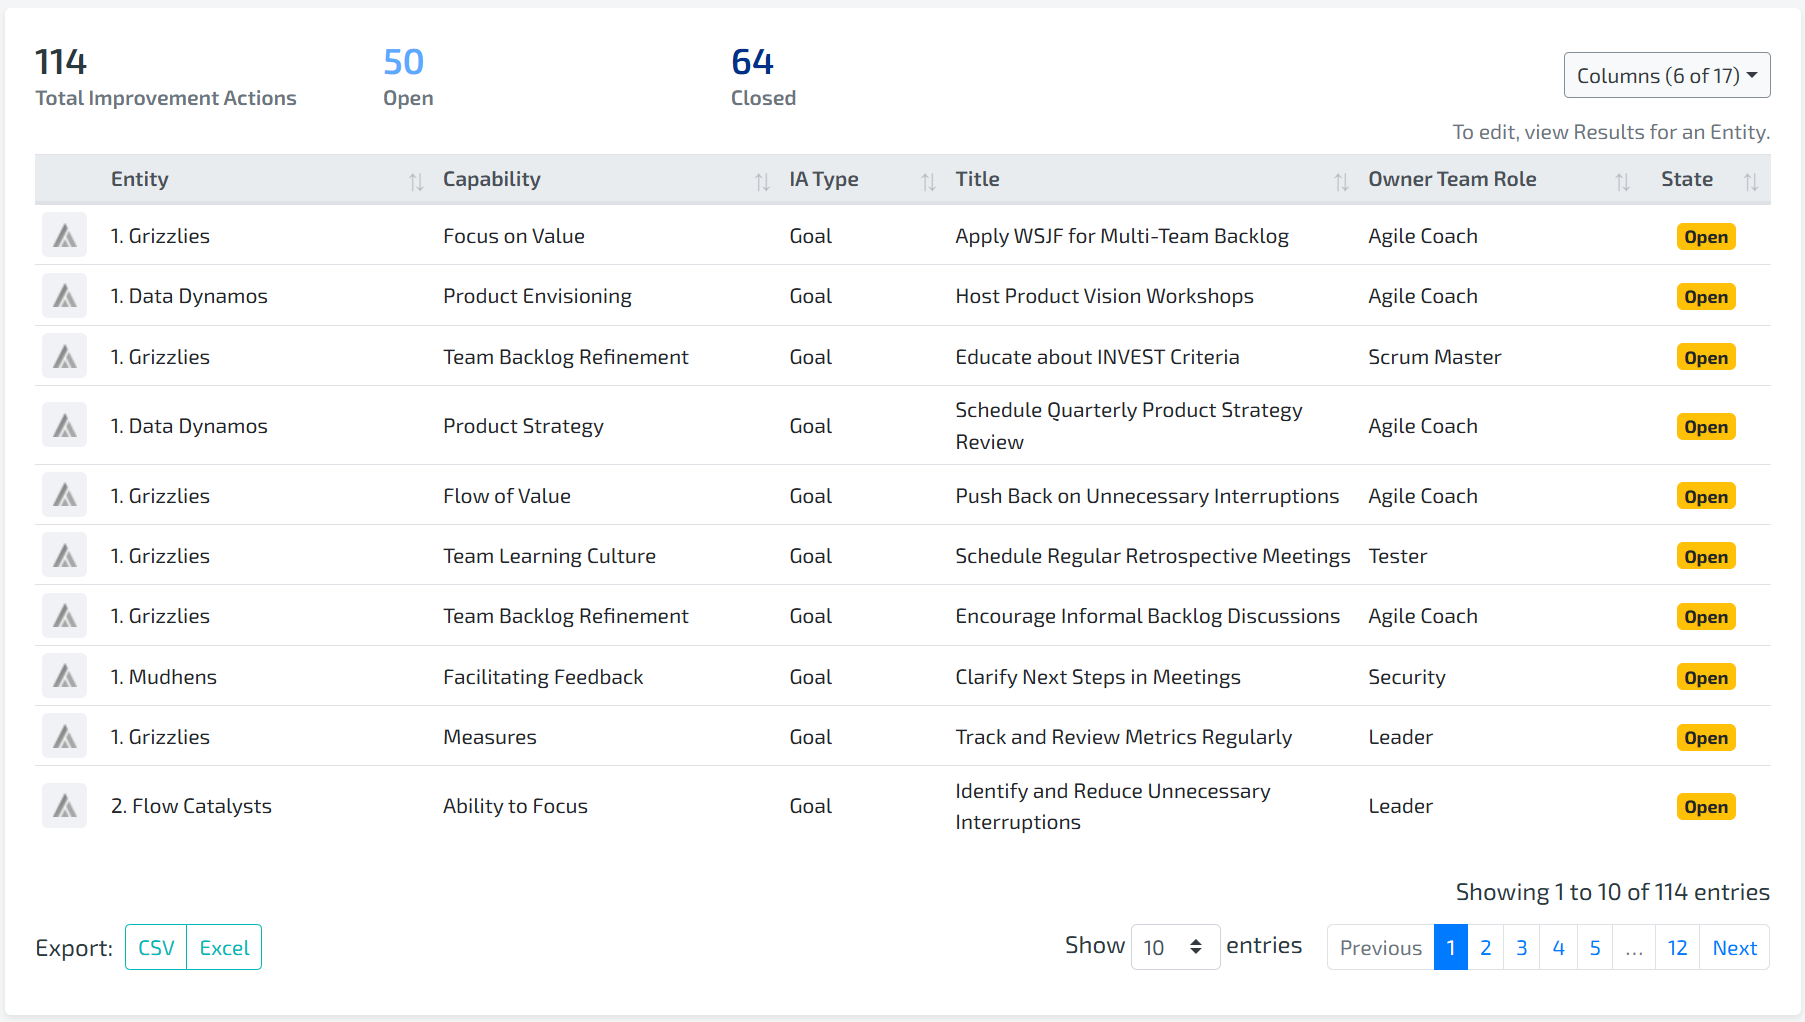
What is the improvement action details widget?
The Improvement Action Details widget is a tabular view of all Improvement Actions for the Entity or Group, including information about the Capability it is associated with.
components
Total improvement Actions: The total count of all Improvement Actions for an Entity or Group.
Open: The number of Improvement Actions with a State of Open
Closed: The number of Improvement Actions with a State of Closed
Displayed Columns: Check and uncheck to show/hide columns of the table
Export CSV/Excel: Exports the raw data of the table, using only the columns in view
Improvement Action Table columns
Logo: Either LAI or Jira logo, depicting if the Improvement Action is LAI-only or has an integration with Jira
Entity: The Entity that owns the Improvement Action. Not shown when viewing Results for an Entity
IA Type: The Type of the Improvement Action
External Link: The Link of the Improvement Action
Title: The Title of the Improvement Action
Description: The Description of the Improvement Action
Owner Team Role: The Team Role of the Owner of the Improvement Action
Capability: The Name of the Capability that the Improvement Action is associated with
Capability Rating: The aggregate average Rating for the Capability that the Improvement Action is associated with. Hover to see the Rating truncated to 2 decimals.
Trend (Previous): A comparison between the previous Trend and the current Trend. When hovering, this displays the previous Trend’s Stage and Rating for the Capability, truncated to 2 decimals.
Up Arrow - If the Rating is greater than the previous Trend’s Rating
Right Arrow - If the Rating is equal to the previous Trend’s Rating
Down Arrow - If the Rating is less than the previous Trend’s Rating
No Arrow - If no previous Trend exists
Trend (First): A comparison between the first Trend and the current Trend. When hovering, this displays the first Trend’s Stage and Rating for the Capability, truncated to 2 decimals.
Up Arrow - If the Rating is greater than the first Trend’s Rating
Right Arrow - If the Rating is equal to the first Trend’s Rating
Down Arrow - If the Rating is less than the first Trend’s Rating
No Arrow - If no first Trend exists
Variability: The standard deviation of all received votes mapped to a dot visual for the Capability that the Improvement Action is associated with.
Zero dots: Standard deviation = 0, all votes are the same (No variability)
One dot: Standard deviation greater than 0 and less than 0.66 (Low variability, high consensus)
Two dots: Standard deviation from 0.67 and up to but not including 1.33 (Medium variability, moderate consensus)
Three dots: Standard deviation of 1.34 or higher (High variability, low consensus)
Assessment Date: The completed date of the assessment that this Improvement Action is associated with (the most recent completed assessment when the improvement action was created).
State: The current state of the Improvement Action
Target Date (UTC): A user-input date of when the Improvement Action is intended to be completed by. Highlights in red when past due and the Improvement Action is still in Open status.
Last Updated (UTC): The last time the Improvement Action was updated (added, edited, or refreshed)
Actions
Refresh Jira Issue: fetch the latest State from Jira for a Jira-integrated Improvement Action
Edit Improvement Action: Make changes to the Improvement Action
Delete Improvement Action: Deletes the Improvement Action
Note: Actions only appear for Admins, Super Users, and Facilitators when viewing Results for an Entity