
1. INTRODUCTION TO COMPARISON MODE
Comparison Mode is a powerful feature within Lean Agile Intelligence designed to provide insightful comparisons between different levels within your organization. This mode allows members to compare Entity Results against Group or Organization Results, or Group Results against other Group or Organization Results. By enabling this feature, members can gain valuable context and identify areas where an entity excels or needs improvement.
Comparison Mode is accessible via two main widgets on the Results page: Rating Trends and Capability Trends. These widgets leverage Comparison Mode to enhance data visualization and analysis, making it easier for clients to track performance trends and make data-driven decisions.
Benefits of Comparison Mode
Enhanced Context: Understand performance in relation to other entities or groups.
Identify Strengths and Weaknesses: Highlight areas of excellence and areas needing improvement.
Data-Driven Decisions: Make informed decisions based on comparative insights.
Customization: Tailor the comparison to focus on specific groups or organizational levels.
2. UTILIZING COMPARISON MODE
How To Turn It ON Or Off
Accessing Comparison Mode:
Navigate to the Account Page. Ensure you have Admin permission level.
Enabling/Disabling Comparison Mode:
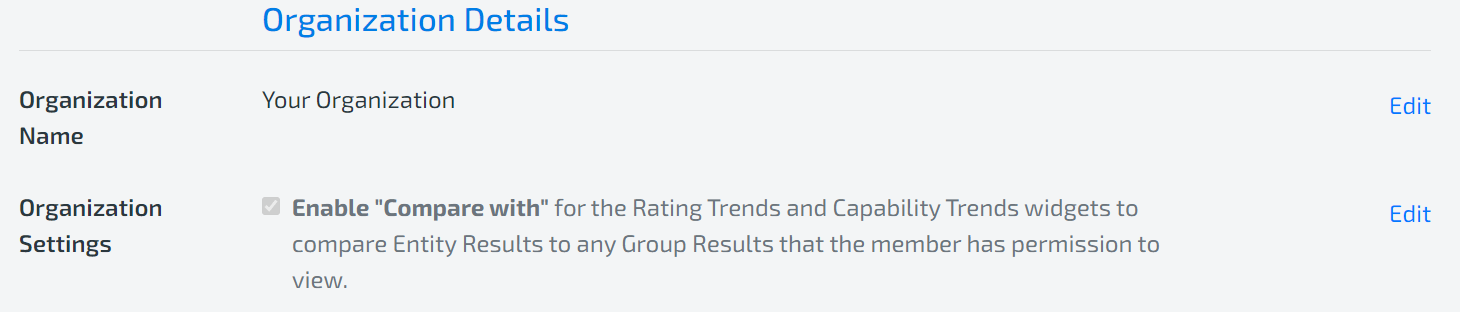
Scroll down to Organization Details and click ‘Edit’ Organization Setting.
Check or uncheck the box to enable the “Compare with” feature.
Note: Registered Members can only view comparisons between Entities and Groups they have permission to view.
3. OVERALL RATING BREAKDOWN
What is the OVERALL RATING BREAKDOWN widget?
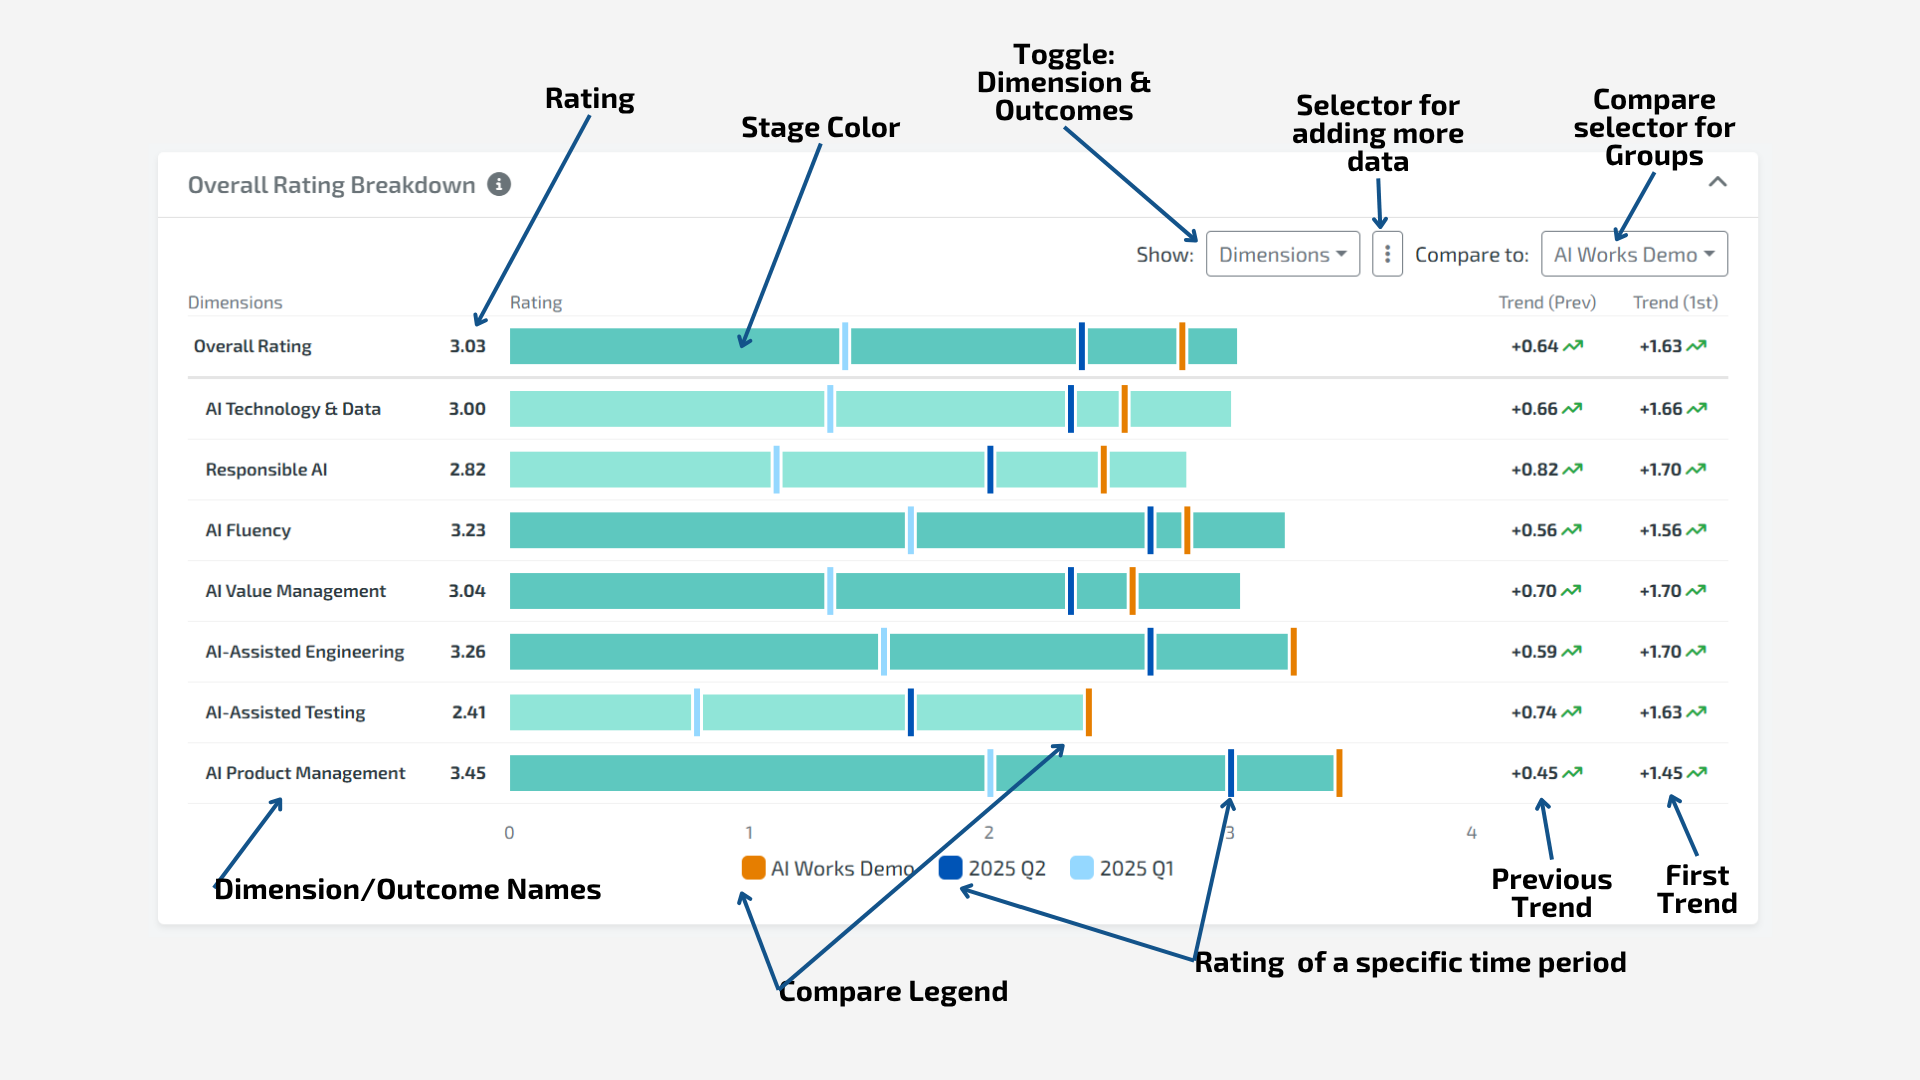
The Overall Rating Breakdown provides a breakdown of the overall rating by dimension or outcome. Learn more about this widget here.
Components And Comparison Feature Overview
Rating Tab: The aggregate average Rating for each Dimension/Outcome for the latest result, truncated to 2 decimals.
Stage Color: Uses the legend at the top of the dashboard to translate the Rating to a Stage.
Toggle: Click this switch between viewing the Dimension Ratings or Outcome Ratings
Selector for adding more data: Allow you to add up to two more columns of data in the Overall Rating Breakdown
Trend (Prev): A comparison between the previous Trend and the current Trend. When hovering, this displays the previous Trend’s Stage and Rating for the Dimension/Outcome, truncated to 2 decimals.
Rating Percentage Trend: A comparison between the first Trend and the current Trend. When hovering, this displays the First Trend’s Stage and Rating.
Up Arrow - If the Rating is greater than the first Trend’s Rating
Right Arrow - If the Rating is equal to the first Trend’s Rating
Down Arrow - If the Rating is less than the first Trend’s Rating
No Arrow - If no first Trend exists
Trend (1st): A comparison between the first Trend and the current Trend. When hovering, this displays the first Trend’s Stage and Rating for the Dimension/Outcome, truncated to 2 decimals.
Rating Percentage Trend: A comparison between the first Trend and the current Trend. When hovering, this displays the First Trend’s Stage and Rating.
Up Arrow - If the Rating is greater than the first Trend’s Rating
Right Arrow - If the Rating is equal to the first Trend’s Rating
Down Arrow - If the Rating is less than the first Trend’s Rating
No Arrow - If no first Trend exists
Total Goals: The sum of the total number of capabilities marked as Goal for each Dimension/Outcome.
Total Impediments: The sum of the total number of capabilities marked as Impediment for each Dimension/Outcome.
Open IAs: The sum of the total number of open Improvement Actions.
Closed IAs: The sum of the total number of closed Improvement Actions.
Comparison Group/Organization:
Displays an orange tab showing the Entity/Group Trend Ratings on the Dimension/Outcome bar.
Available at the Entity and Group levels, limited to groups the member has permission to view.
Hover over each tab in the bar to see the truncated comparison rating.
Compared Trends are bucketed similarly, with specific handling for different Dimension/Outcome.
4. CAPABILITY RATINGS
What IS THE Capability trends widget?
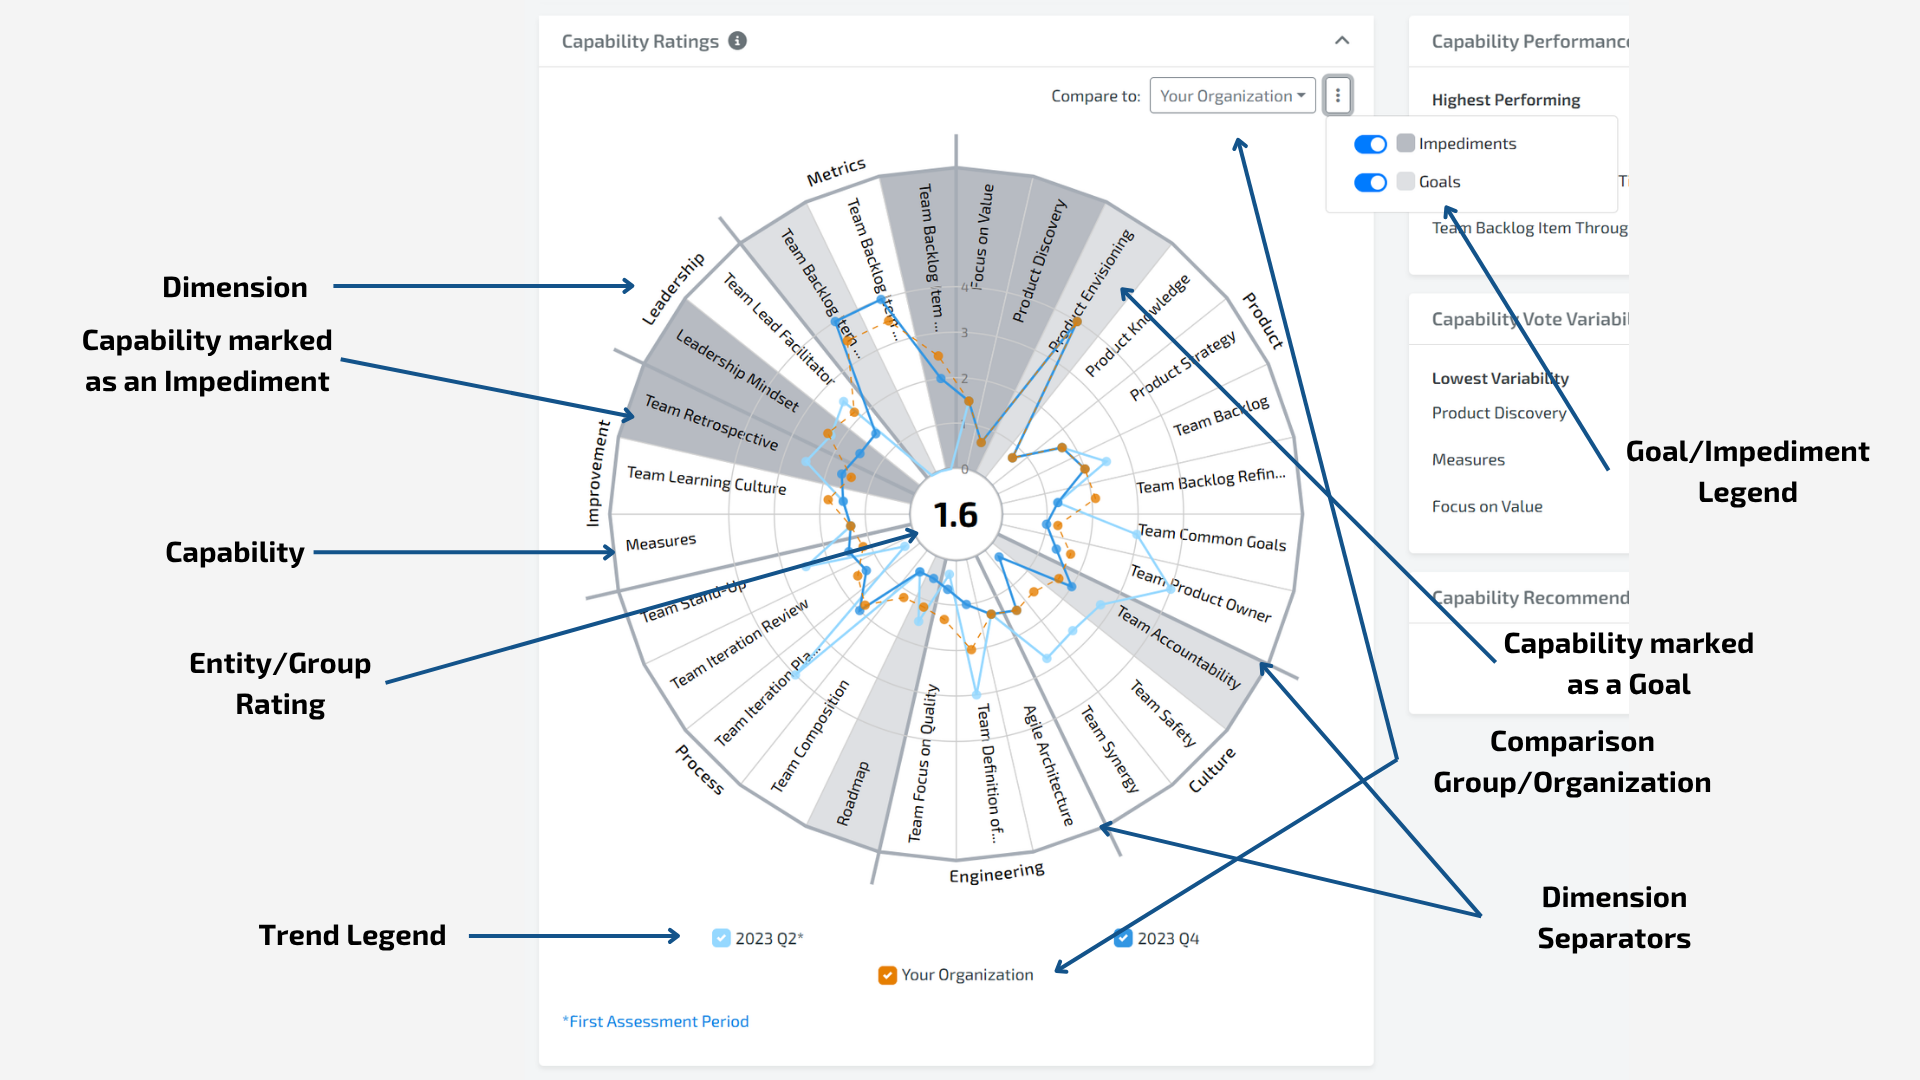
The Capability Trends widget provides a detailed overview of all assessed Capabilities displayed as a pie chart grouped by their Dimension, labeled as Goals or Impediments. Learn more about this widget here.
Components And Comparison Feature Overview
Capabilities:
Displayed and grouped by Dimension. If more than 40, Capability Name will be omitted.
Marked as Goals or Impediments using legend colors.
Entity/Group Rating:
Aggregate average Rating of all assessed Capabilities, truncated to 1 decimal.
Goal/Impediment:
Marked based on the most recent Trend for each team. Hover over Capability for details.
Capability/Trend Ratings:
Each Rating is a dot in the Capability pie slice. Trends displayed with the most recent on top.
Hover over dots to see which Trend they represent. Checked/unchecked Trends to focus on specific data.
Comparison Group/Organization:
Overlays Ratings over displayed Capabilities for comparison. Latest Trend used if available.
Only Capability/Trend Ratings are compared; Entity/Group Ratings and Goals/Impediments are not displayed for the compared Group/Organization.
Comparison Group/Organization: The Group or Organization to include in the Capability/Trend Ratings
Comparison mode is only available at the Entity and Group levels.
Only the Groups that the member has permission to view will be available to select
If comparison mode is used, the latest Trend for the compared Group or compared Organization is used.
If the compared Group or Organization has no Trends, then no Trends will be displayed.
By default, only the latest Trend from the Entity is selected for display. However, you can check/uncheck the Trends to show/hide all Trends.
Note: If there are more than 4 trends available, you can select the trend you want to display on the chart by selecting the trend in the dropdown next to the trend label.
The compared Group/Organization will not modify the Capabilities displayed, it will only overlay its Ratings over the displayed Capabilities. If the compared Group/Organization does not have a Rating for a Capability, then the displayed Trend line will move towards the center.
Only the Capability/Trend Ratings are compared. The Entity/Group Rating and Goals/Impediments are not displayed for the compared Group/Organization.
Utilizing the Comparison Mode and understanding the Rating and Capability Trends widgets can provide significant insights into organizational performance. These tools allow for strategic decision-making by highlighting strengths and areas for improvement, ensuring continuous growth and development.